


Gold and Silver End of Week Technical, CoT and Fundamental Status
Commodities / Gold & Silver 2019 Apr 28, 2019 - 02:49 PM GMTBy: Gary_Tanashian

 After an interesting week and to allow more focus on charting the miners this weekend, we again offload much of the NFTRH Precious Metals segment’s content to the public site. The following is (hopefully) going to be long on charts and relatively short on words (sighs of relief palpable…).
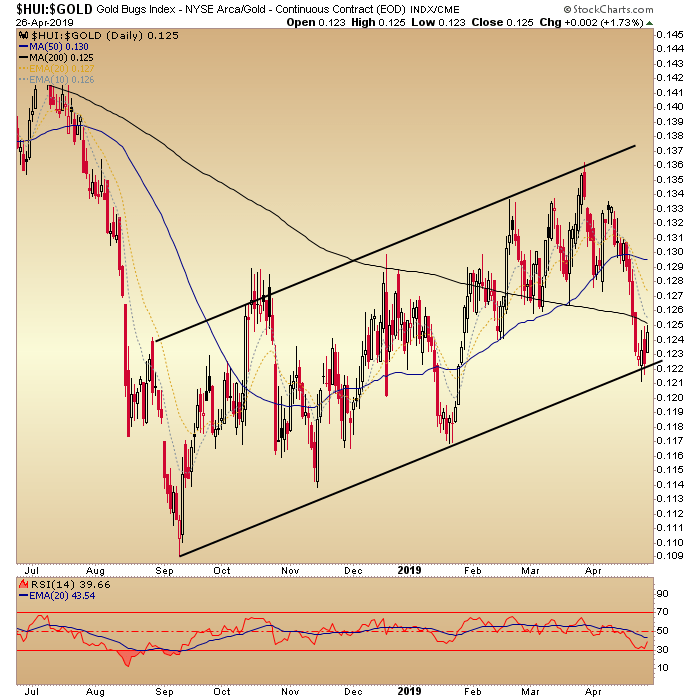
HUI/Gold Ratio is intact to its higher lows from September. This was a logical bounce point for gold stocks. HGR needs to promptly take back the SMA 200, however.
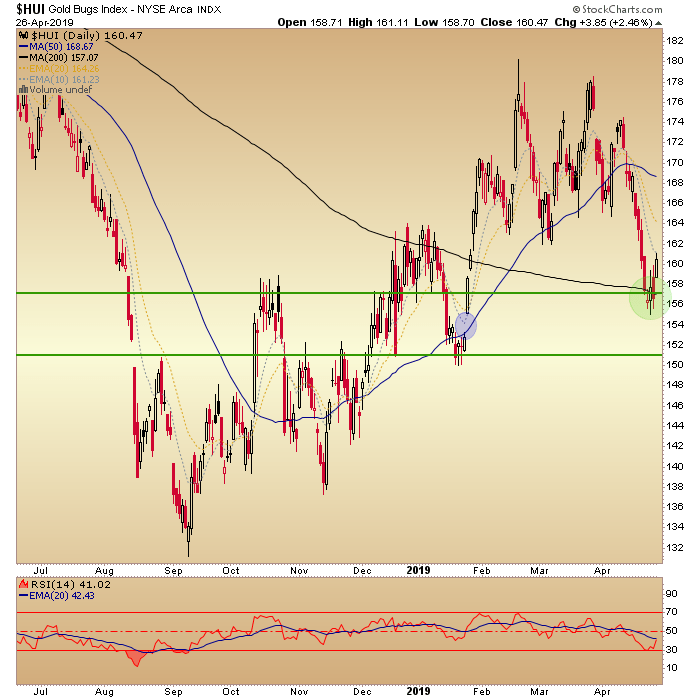
HUI has so far held our favored support area at a higher low. That is the daily SMA 200. As noted last week, it could fill the gap at 152 and maintain an all-important higher low. That is critical. Meanwhile, we’re on a bounce from a logical point after becoming somewhat oversold.
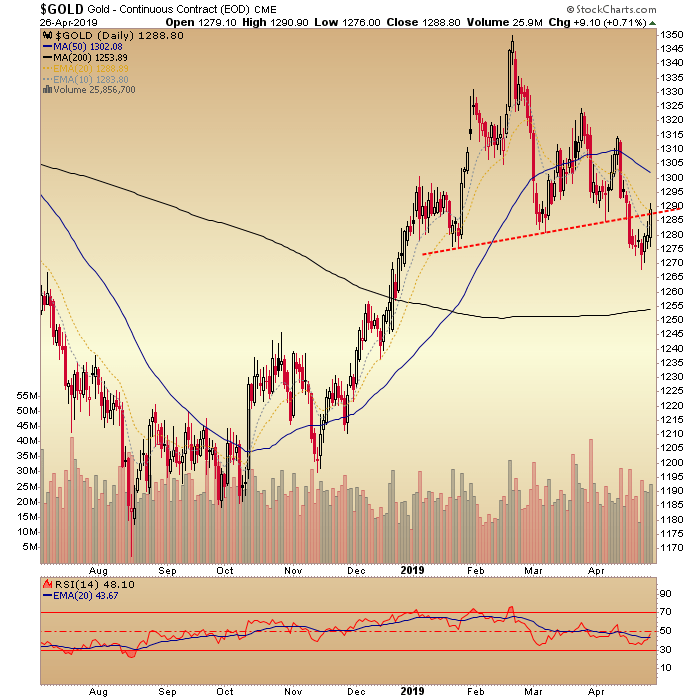
Gold is trying to negate the bearish daily chart pattern. It has not quite done so yet, but bears watching. It has not neared my best target in the 1250s at the SMA 200. Hey, I could be wrong or could be right. The market however, will be right and it should let us know the answer next week.
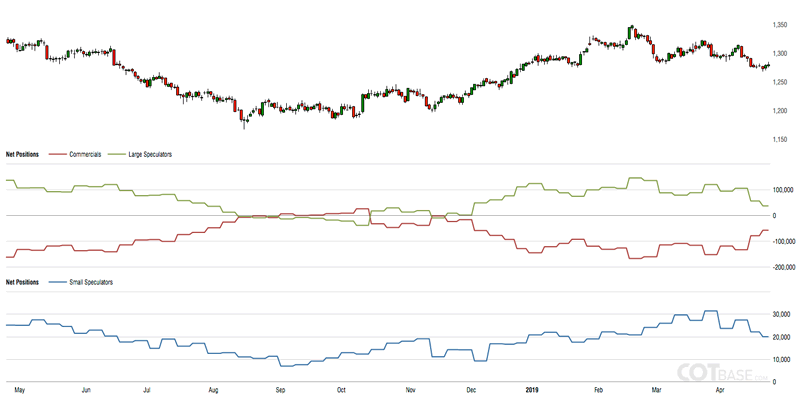
From COTbase, here is a pleasing view of more large and small Spec puking and Commercial short covering on the Gold CoT. The trend however, may still not be complete. It is the trend that matters, not the knee jerk spikes up and down that some react to.
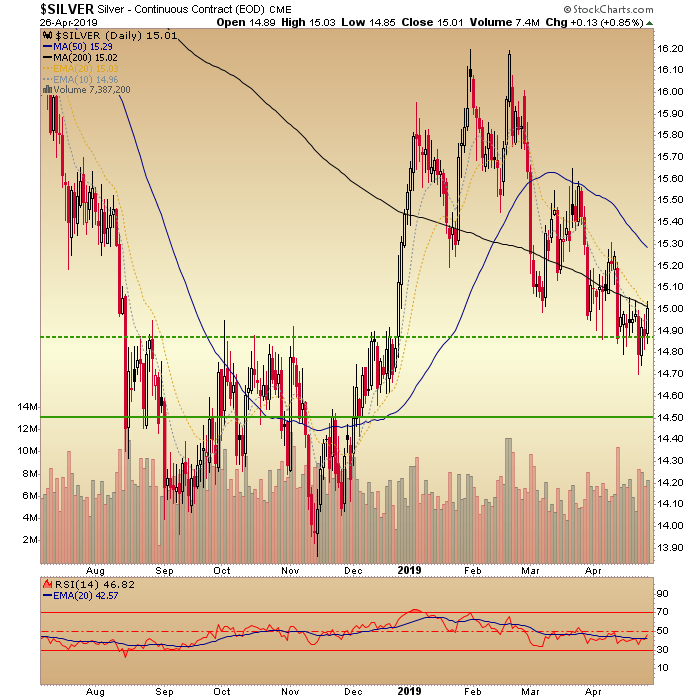
Silver broke through the favored support area and recovered quickly. The lower one is still open, however. Silver lurks below the down trending SMA 200 and as long as that is the case, don’t discount 14.50.
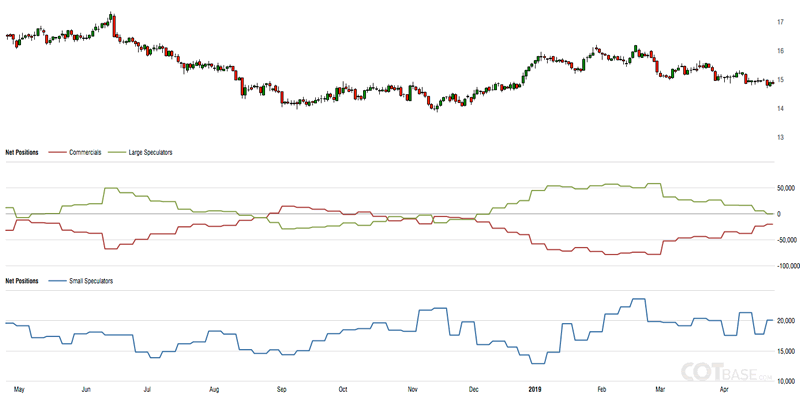
The Silver CoT has been better than gold’s but the gulf between them has narrowed. In fact, while the drop in small Spec bullishness on gold’s CoT was pleasing, the bump up in small Spec bullishness in silver is not. All in all though, continued good progress on the silver CoT.
Let’s now move from the technical and sentiment (CoT) to the macro/sector fundamental.
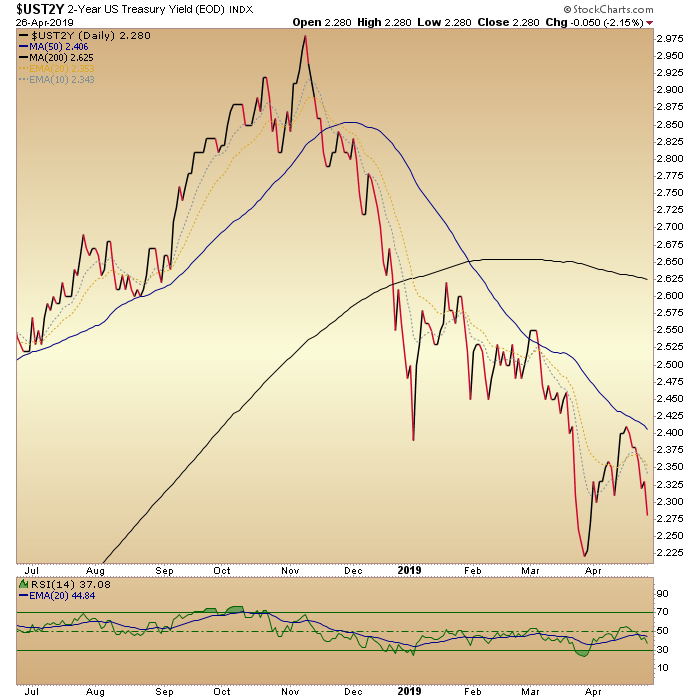
2 Year Yield has turned down again, which is a big positive as it implies economic weakness and fading support for the US dollar.
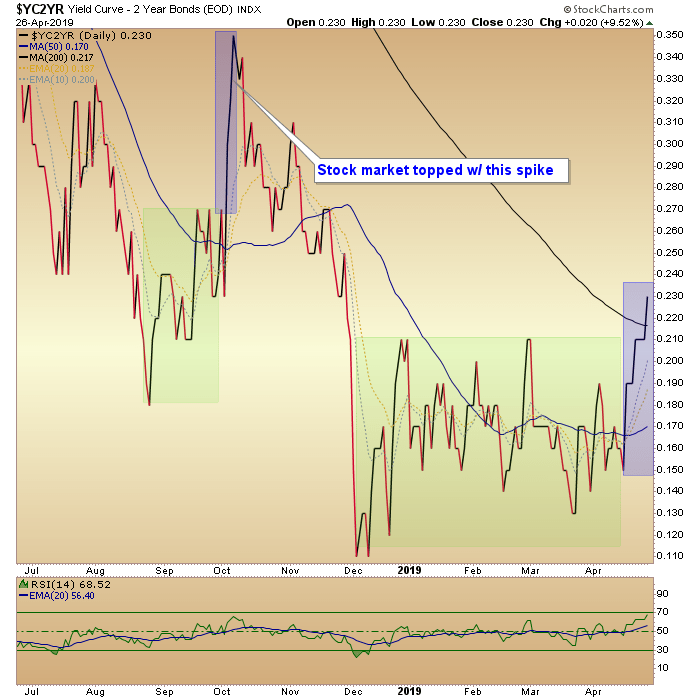
The 10yr-2yr Yield Curve has spiked. Another positive because a steepening curve, whether under pains of deflation or inflation, is a net positive for gold and gold stocks. Note however, that the pain did not start for the stock market until the impulsive spike in the Yield Curve, which immediately preceded the October correction. Is the curve impulsive enough yet? There could be a little more work to do, especially since the major trend for the Yield Curve is still on a flattener.
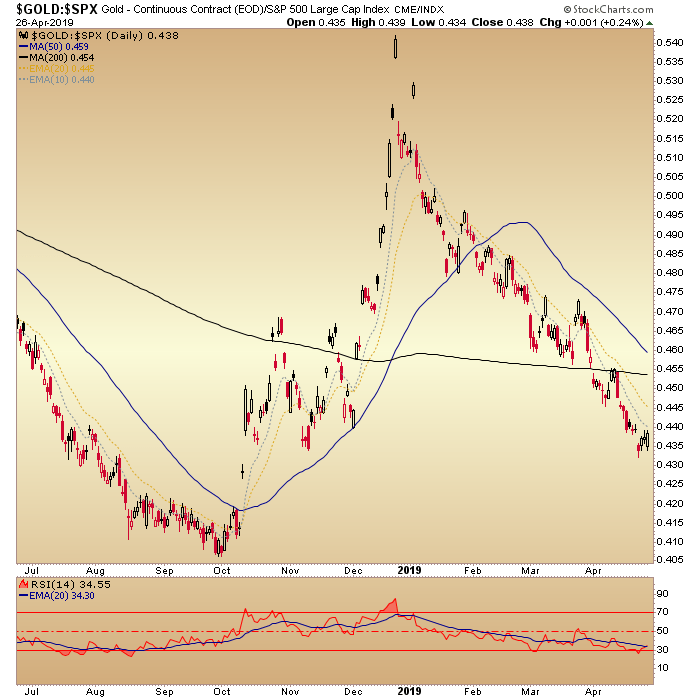
Of course, a steepening yield curve would directly inform this still bearish (or at best, harshly consolidating) indicator, Gold vs. S&P 500.
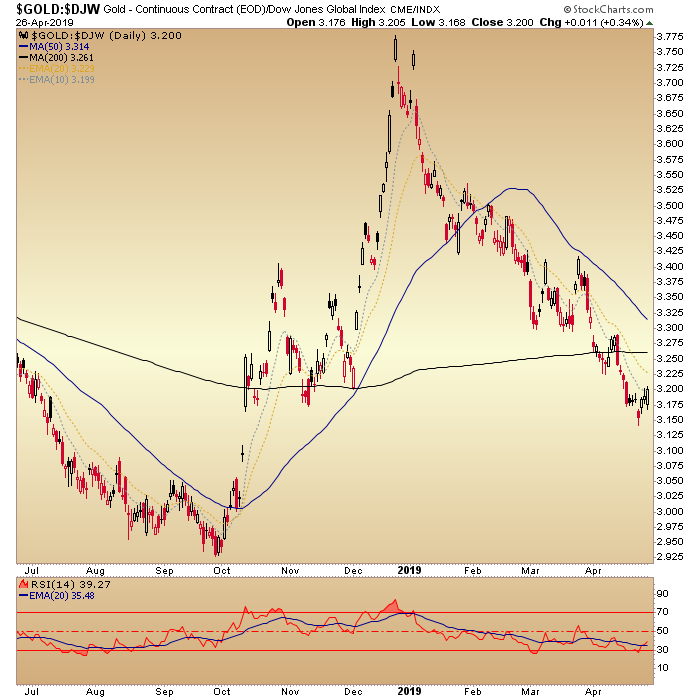
The same holds true for this one, Gold vs. Global Stocks.
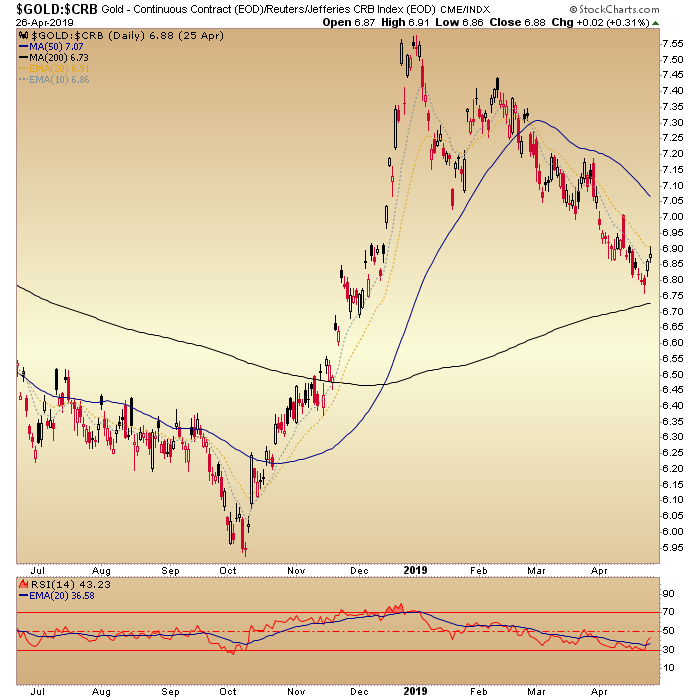
Gold/CRB bounced this week but remains in a hard consolidation. Importantly, Gold/WTI Oil and Gold/GYX (industrial metals) bounced well and bear watching. They are probably the two most important factors within the general Au/Commodities sphere.
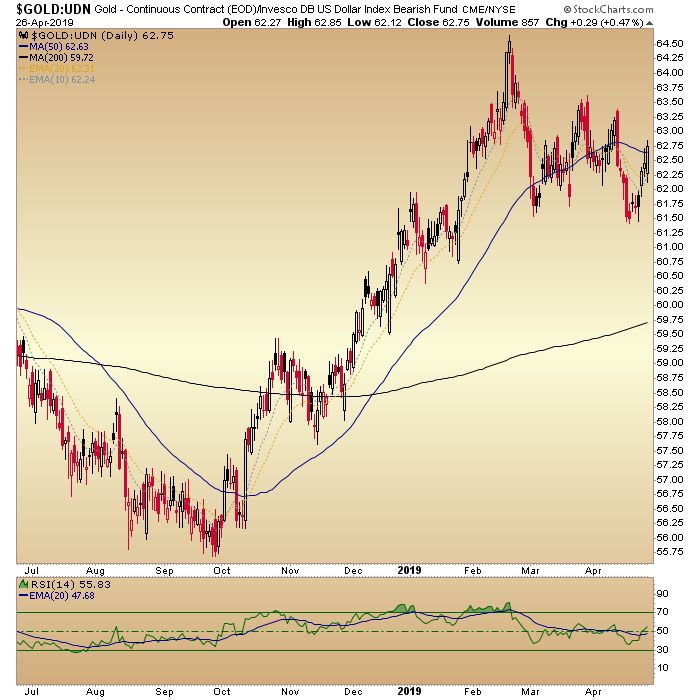
Gold vs. Global Currencies (Au/UDN proxy) has been in consolidation in 2019 but is far from broken. Speaking of broken, we noted in NFTRH last year when this indicator broke out and though not visible on this chart, it continues to hold that status.
Bottom Line
What, you wanted pompoms? The above is a snapshot of where things currently stand on the daily chart technicals, an important sentiment indicator (CoT) and some of the fundamentals that actually matter. I think that standing is constructive. Let’s see what next week brings and hope the golden pompoms don’t get out of hand again.
Subscribe to NFTRH Premium (monthly at USD $33.50 or a 14% discounted yearly at USD $345.00) for an in-depth weekly market report, interim market updates and NFTRH+ chart and trade setup ideas, all archived/posted at the site and delivered to your inbox.
You can also keep up to date with plenty of actionable public content at NFTRH.com by using the email form on the right sidebar and get even more by joining our free eLetter. Or follow via Twitter ;@BiiwiiNFTRH, StockTwits or RSS. Also check out the quality market writers at Biiwii.com.
By Gary Tanashian
© 2019 Copyright Gary Tanashian - All Rights Reserved
Disclaimer: The above is a matter of opinion provided for general information purposes only and is not intended as investment advice. Information and analysis above are derived from sources and utilising methods believed to be reliable, but we cannot accept responsibility for any losses you may incur as a result of this analysis. Individuals should consult with their personal financial advisors.
Gary Tanashian Archive |
© 2005-2022 http://www.MarketOracle.co.uk - The Market Oracle is a FREE Daily Financial Markets Analysis & Forecasting online publication.