


Stock Market Breadth Warning Signs for the Stock Market’s Rally?
Stock-Markets / Stock Markets 2019 Jul 23, 2019 - 02:54 PM GMTBy: Troy_Bombardia

 As the stock market trades on light volume, various breadth indicators are flashing short term warning signs. Today’s headlines:
- A real breadth divergence.
- Weaker than average economic growth
- Lagging margin debt
- Baltic Dry Index surge
- Gold:silver ratio
- Netflix
Go here to understand our fundamentals-driven long term outlook. For reference, here’s the random probability of the U.S. stock market going up on any given day.

Breadth
With the major stock indices (S&P, Dow, NASDAQ) near all-time highs, various breadth indicators are flashing warning signs. One of these is the % of NASDAQ stocks above their 200 dma.
As you can see, fewer than half of NASDAQ stocks are above their 200 dma, while the NASDAQ Composite is near all-time highs. This suggests that many stocks are lagging the index, which is held up by larger cap stocks.
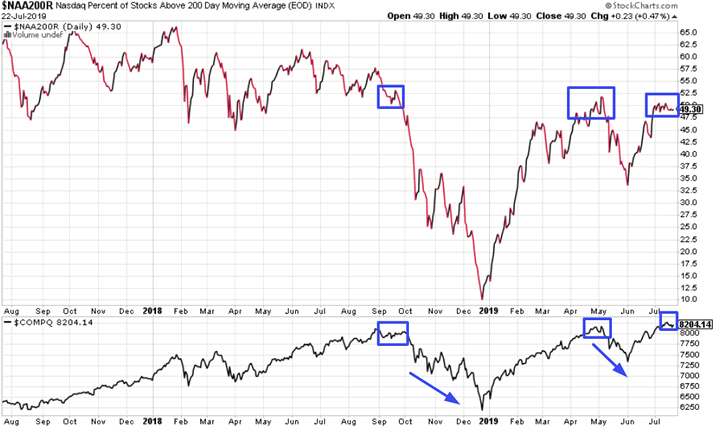
The last 2 times this happened was September-October 2018, and May 2019. Both cases were followed by corrections. But to avoid recency bias, here’s every single date that saw similar breadth conditions.
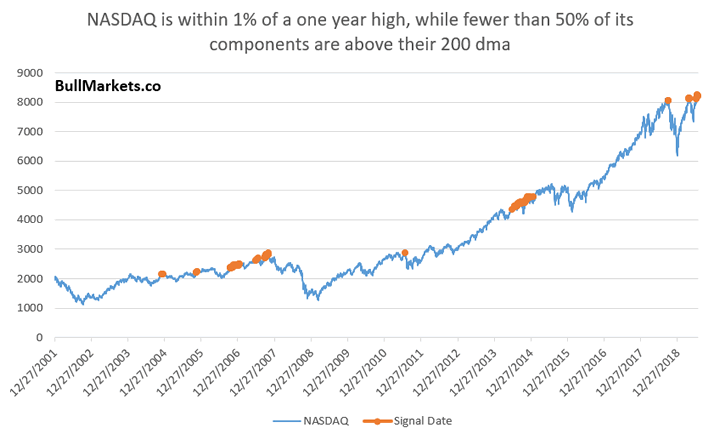
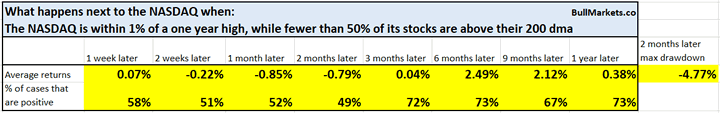
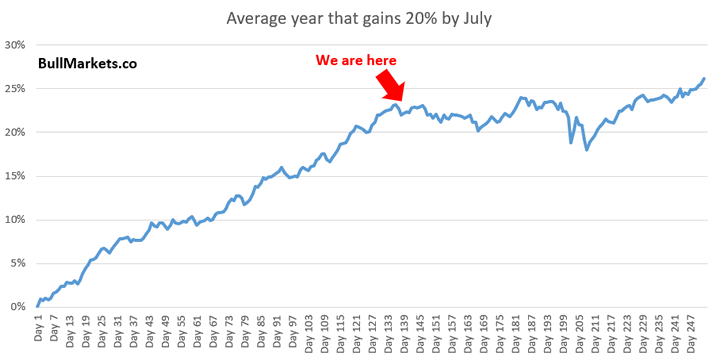
This occurred on 131 historical days, and the NASDAQ’s returns up to 2 months later were weaker than random. Remember what we said over the weekend: after a big 7 month rally, the next few months will probably see choppy price action.
Economic growth
Liz Ann Sonders tweeted about an interesting indicator:
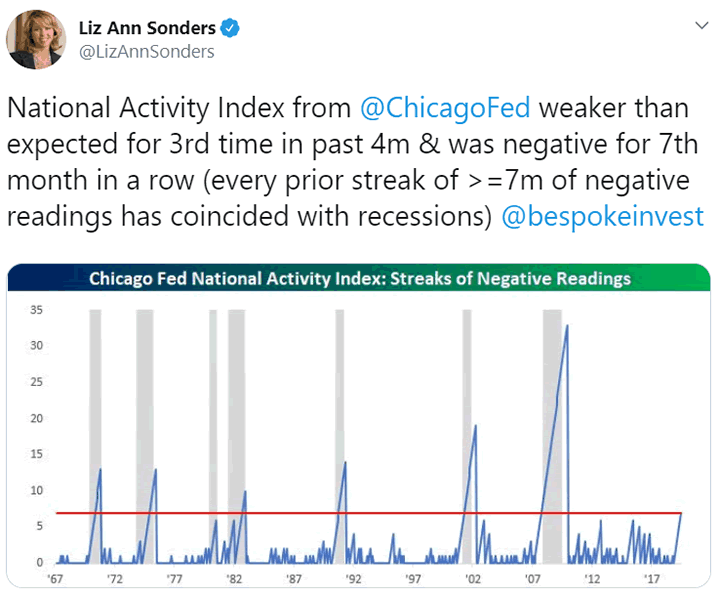
Here’s the explanation for this indicator, from FRED:
A zero value for the index indicates that the national economy is expanding at its historical trend rate of growth; negative values indicate below-average growth; and positive values indicate above-average growth.
In other words, economic growth has been weaker than average for 7 consecutive months. Here’s what happened next to the S&P (historically):
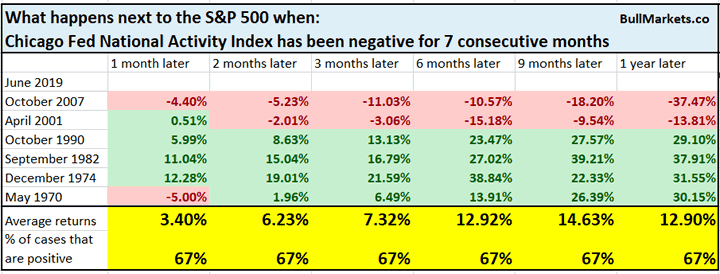
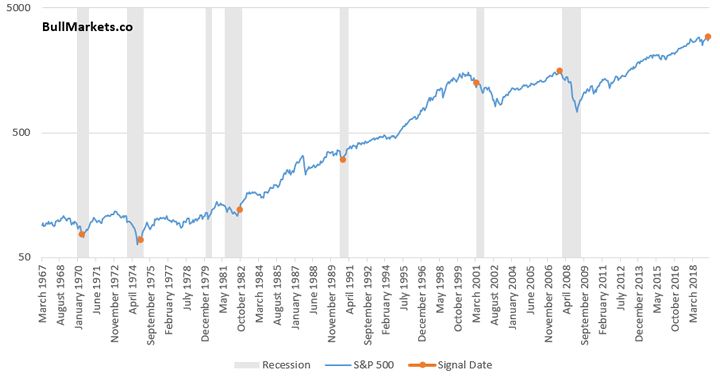
In the past, this always happened in a recession. Sometimes this happened at the start of a recession (2001, 2007), and sometimes this happened at the end of a recession (1970, 1974, 1982).
This indicator is flawed, in my opinion.
- What matters isn’t whether or not nominal growth is above or below average. (because growth will be above average 50% of the time and below average 50% of the time)
- What matters is whether or not the economy is growing.
Look at the indicator again. You can see that there have been streaks of “6 months” in 2012 and 2015. The current economic expansion has been marked by consistently weaker than average growth. Slow growth is the new normal.
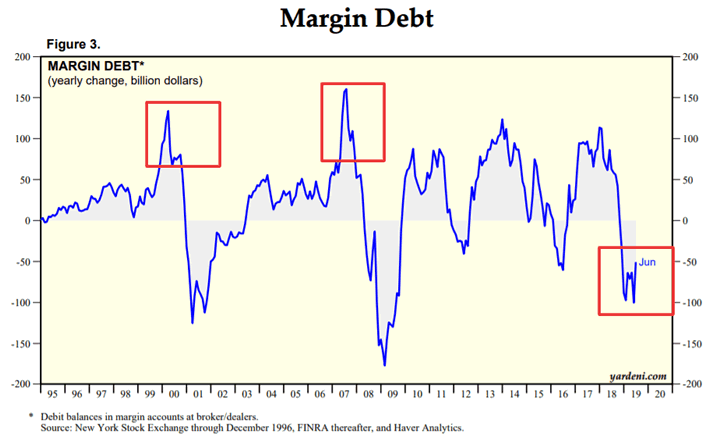
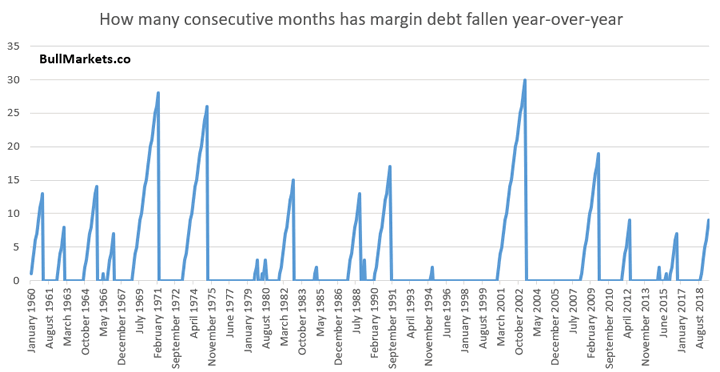
Margin Debt
Margin debt growth continues to be weak, which is very different from the 2000 and 2007 bull market tops. This is the 9th consecutive month in which year-over-year margin debt growth is negative.
Here’s what happened next to the S&P when similar historical streaks occurred.
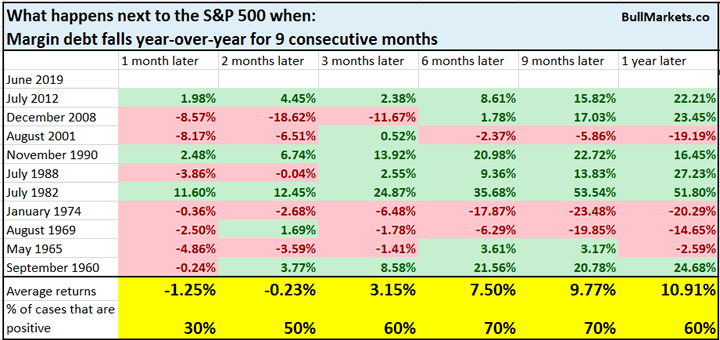
We can notice something interesting here. Most of these cases (including the bearish historical cases) occurred when the S&P was far below its all-time high. Since margin debt usually moves inline with the S&P, margin debt contraction usually coincides with a stock market that has already fallen. Very rarely does such a low amount of margin debt growth occur when the stock market is near all-time highs.
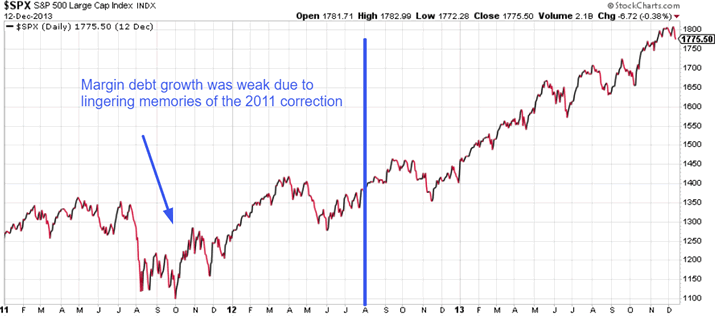
There are only 2 other historical cases in which margin debt fell year-over-year for 9 consecutive months, while it was within -10% of a 1 year high:
- Now
- July 2012
- May 1965
BDI
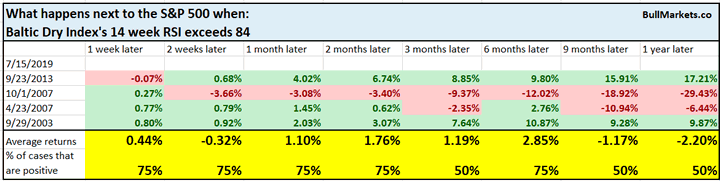
The Baltic Dry Index continues to surge to multi-year highs. As a result, its weekly RSI (momentum indicator) is now at 84. This is exceptionally high.
*The Baltic Dry Index is a measure for global shipping.
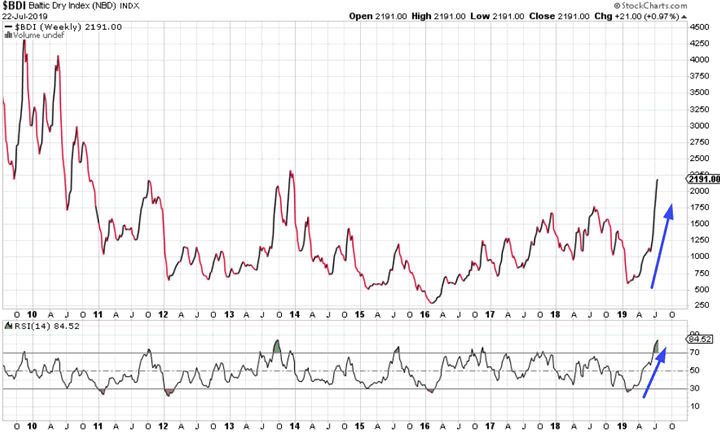
There are only 4 other historical cases that saw such a high weekly RSI for the Baltic Dry Index. Since this indicator is mean reverting, it usually fell over the next 9 months.
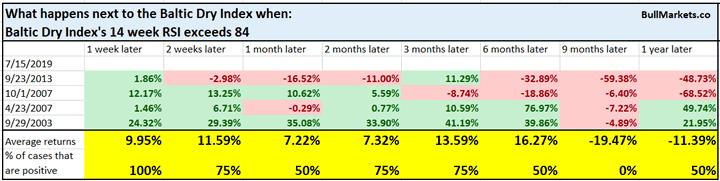
But this was not consistently bullish or bearish for the S&P.
Ratio
Gold and silver have surged over the past few months, and sentiment is high. This typically leads to short term weakness. While the first leg of the precious metals rally was led by gold, the more recent leg was led by silver. That’s why the gold:silver ratio spiked at first, and then tanked.

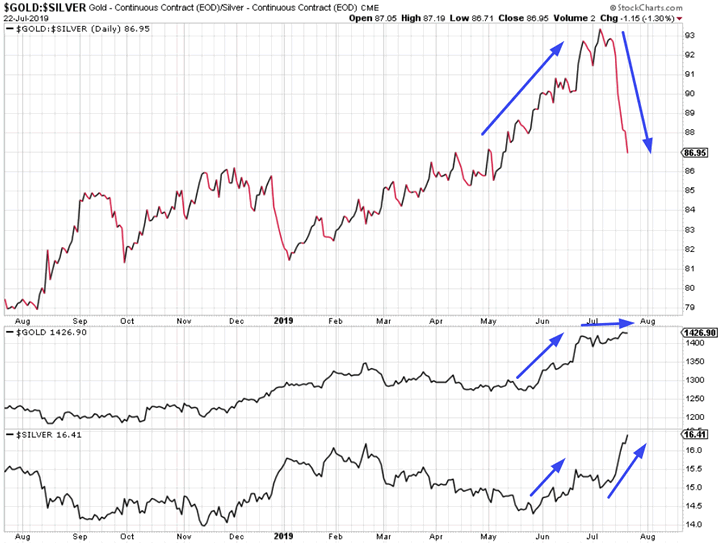
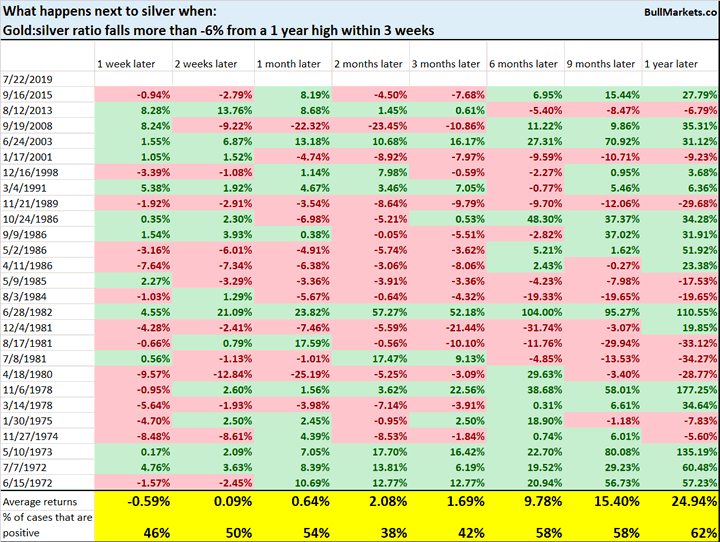
Jumping on the silver bandwagon right now may be the popular thing to do, but it isn’t always the best thing to do. When the gold:silver ratio dumped from a 1 year high, silver’s 2-3 month forward returns were more bearish than random.
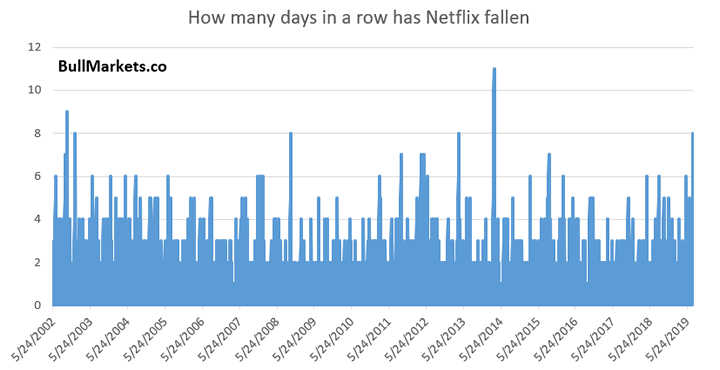
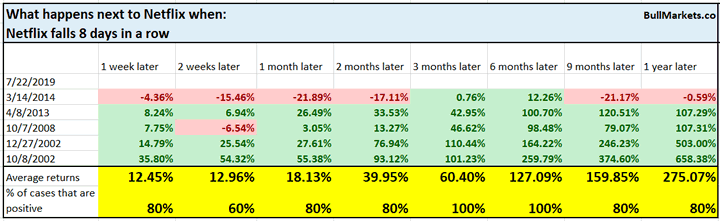
Netflix
And lastly, Netflix has fallen 8 days in a row.
We don’t use our discretionary outlook for trading. We use our quantitative trading models because they are end-to-end systems that tell you how to trade ALL THE TIME, even when our discretionary outlook is mixed. Members can see our model’s latest trades here updated in real-time.
Conclusion
Here is our discretionary market outlook:
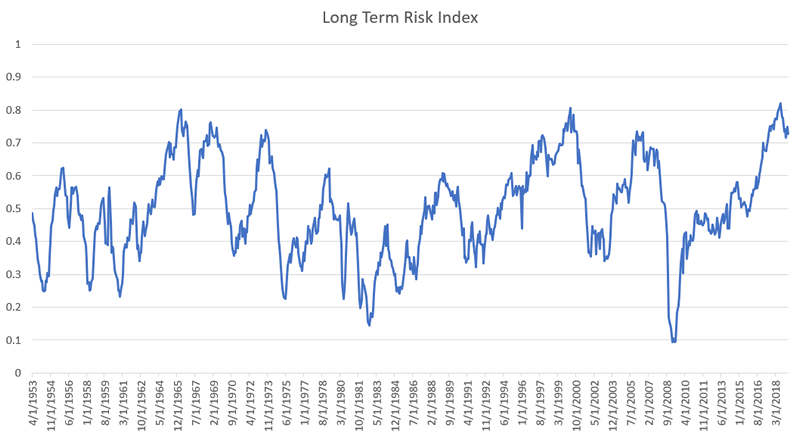
- Long term: risk:reward is not bullish. In a most optimistic scenario, the bull market probably has 1 year left.
- Medium term (next 6-9 months): most market studies are bullish.
- Short term (next 1-3 months) market studies are neutral/bearish.
- We focus on the medium-long term.
Goldman Sachs’ Bull/Bear Indicator demonstrates that risk:reward favors long term bears.
Click here for more market analysis
Here’s what happens next to the S&P when lumber rallies above its 50 week moving
By Troy Bombardia
I’m Troy Bombardia, the author behind BullMarkets.co. I used to run a hedge fund, but closed it due to a major health scare. I am now enjoying life and simply investing/trading my own account. I focus on long term performance and ignore short term performance.
Copyright 2019 © Troy Bombardia - All Rights Reserved
Disclaimer: The above is a matter of opinion provided for general information purposes only and is not intended as investment advice. Information and analysis above are derived from sources and utilising methods believed to be reliable, but we cannot accept responsibility for any losses you may incur as a result of this analysis. Individuals should consult with their personal financial advisors.
Troy Bombardia Archive |
© 2005-2022 http://www.MarketOracle.co.uk - The Market Oracle is a FREE Daily Financial Markets Analysis & Forecasting online publication.