


The Yield Curve flattener and a Coming Transition
Interest-Rates / Inverted Yield Curve Mar 25, 2022 - 07:05 PM GMTBy: Gary_Tanashian

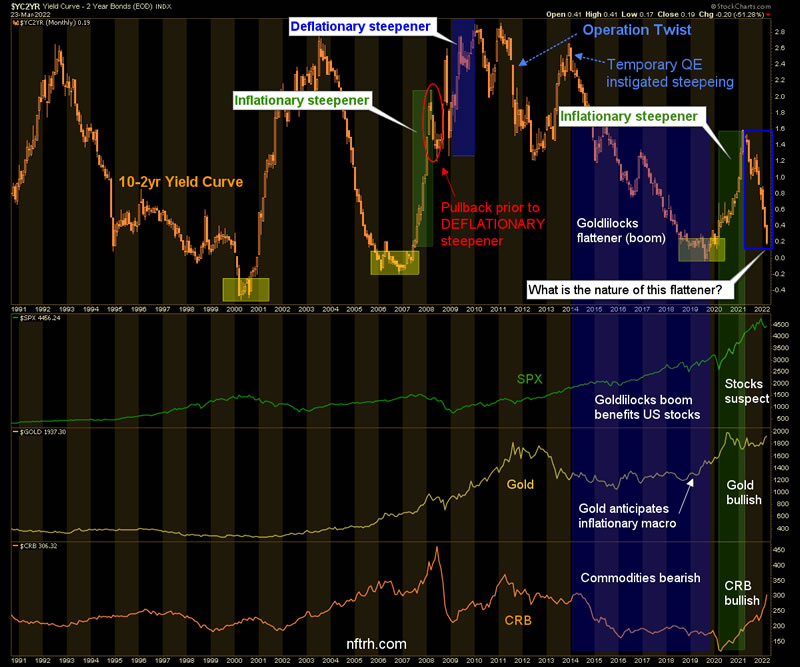
As the Yield Curve flattens, this inflation is different from the 2020 inflation
In 2020 an inflationary yield curve steepener was in the bag as the Fed dropped and pinned the Funds Rate and sucked up every bond it could get its hands on (in order to monetize/print). The bond market made the logical signals about the resulting inflation as the short end was pinned by a combination of Fed policy and the frightened, risk ‘off’ herds clustered in T-Bills and short-term Treasuries, relative to the long end.
Gold and then stocks picked up on it first, followed by commodities, which were tardy but are now the star performer late in the inflation cycle. Hmm…
Side Note: The most buyable looking chart in the lower panels? On this big picture, that would be gold.
I had originally thought a new flattener may be limited in the way that the 2008 mini flattener was before it transitioned deflationary. Instead, today’s yield curve is flattening toward inversion. But this flattener is not a Goldilocks ‘boom’ flattener by any means. It’s a flattener driven by tardy Fed policy relative to market signals. in other words, driven by policy falling well behind the market’s inflation signals.
Enter the 2yr yield, which is the short end of the 10yr-2yr curve above. It has gone impulsive ‘up’ and the T-Bill is picking up on the theme as well. Meanwhile, our supposedly hawkish Fed boosted the Funds rate a whole .25% at the last FOMC meeting. Who are they kidding with this pretense?
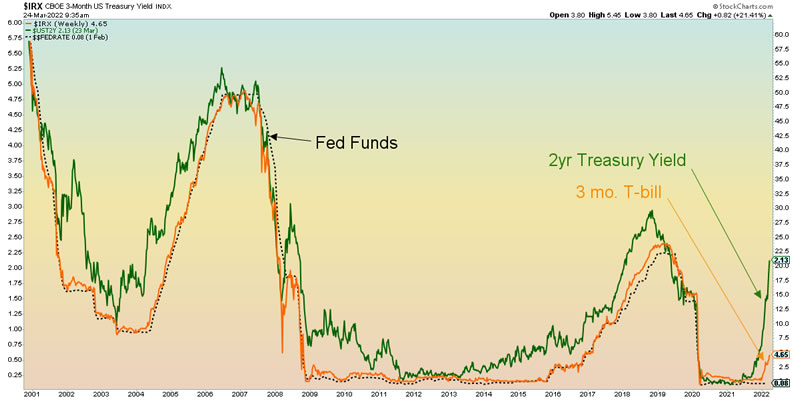
So the nature of the yield curve flattener is inflationary, by definition. The Fed is absolutely behind the curve as shown directly above and the bond market is not impressed. Instead, the bond market is pushing the Fed, which seems to have its eyes closed, its fingers in its ears going ‘la la la… I can’t hear you… la la la’ as the curve nears inversion. Normally, inversion is something media trumpet as a recession signal, but as we’ve often noted in the past, it’s not the inversion that typically signals an oncoming recession, it’s the subsequent steepening that would bring on an economic bust.
I have long had a theory that traditional market signals have been so messed up by ever more maniacal, nontraditional and intrusive policy input as to often be rendered dysfunctional. An inflationary flattener?? Brought to you by the modern Federal Reserve.
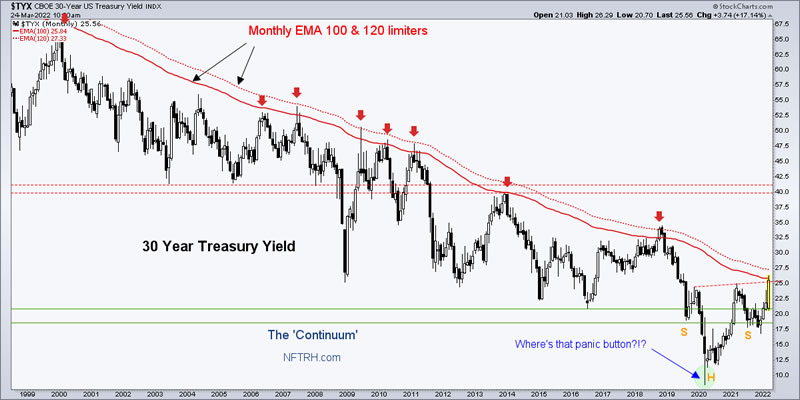
Whatever it is, it is transitional. The next steepener could either be hell-flationary or deflationary, as noted in last week’s article. The 30yr yield Continuum has, after all, banged the target we’ve had in play since mid-2020.
While I will not be so buffoonish as to try to predict what comes next in order to harvest eyeballs, I will certainly tighten up NFTRH tracking of the indicators to keep us on the right side of it. At the moment the analysis is obviously inflationary and my holdings reflect that, especially now that a late stage blow off indicator may be engaging.
But today’s happy-go-lucky inflation traders should be wary of decision points upcoming in the likes of the 30yr Treasury yield’s traditional limits *, the yield curve’s limited downside prior to inversion and a host of other indicators calling for a macro decision coming soon. For now my gut tells me the play is late stage inflation (possibly including a significant upside blow off) but the transition will probably lead to a deflationary resolution. But the other option is as the Fed seems to be courting, “a bit of the old Ludwig van”. That would be ole’ von Mises’ crack-up-boom.
* Again, with modern policy having rendered traditional indicators prone to dysfunction, it’s best to stay open minded until enough signals register a unified theme.
For “best of breed” top down analysis of all major markets, subscribe to NFTRH Premium, which includes an in-depth weekly market report, detailed interim market updates and NFTRH+ dynamic updates and chart/trade setup ideas. You can also keep up to date with actionable public content at NFTRH.com by using the email form on the right sidebar. Follow via Twitter ;@NFTRHgt.
By Gary Tanashian
© 2022 Copyright Gary Tanashian - All Rights Reserved
Disclaimer: The above is a matter of opinion provided for general information purposes only and is not intended as investment advice. Information and analysis above are derived from sources and utilising methods believed to be reliable, but we cannot accept responsibility for any losses you may incur as a result of this analysis. Individuals should consult with their personal financial advisors.
Gary Tanashian Archive |
© 2005-2022 http://www.MarketOracle.co.uk - The Market Oracle is a FREE Daily Financial Markets Analysis & Forecasting online publication.