


Will Global Markets Be Pushed Deeper Into Crisis Event By The US Fed?
Stock-Markets / Stock Market 2022 Jun 19, 2022 - 09:44 PM GMTBy: Chris_Vermeulen

US and Global markets recoiled from the higher inflation/CPI data last week. The US Fed raised interest rates by 75pb on June 15. The Fed also warned that other, more aggressive rate increases might be necessary later this year. Before the Fed decision, global markets opened on Sunday, June 12, and quickly started selling downward. US Indexes sold off on Monday, June 13, by more than 2.5% almost across the board. A brief rally after the Fed decision seems to have evaporated in early trading on Thursday, June 16.
It is clear that global markets expected inflation to stay elevated but were hoping for some moderately lower data showing the recent Fed moves had already dented some inflation concerns. Now, it appears the US Fed has its backs against a wall and moved rates aggressively higher to stall inflation (and possibly destroy global asset values). From my perspective, this is unknown territory for the US Fed and Global Central banks. That means traders should expect increased volatility and the possibility of a very determined reversion of price over time.
Another Global Financial Crisis May Be Unfolding
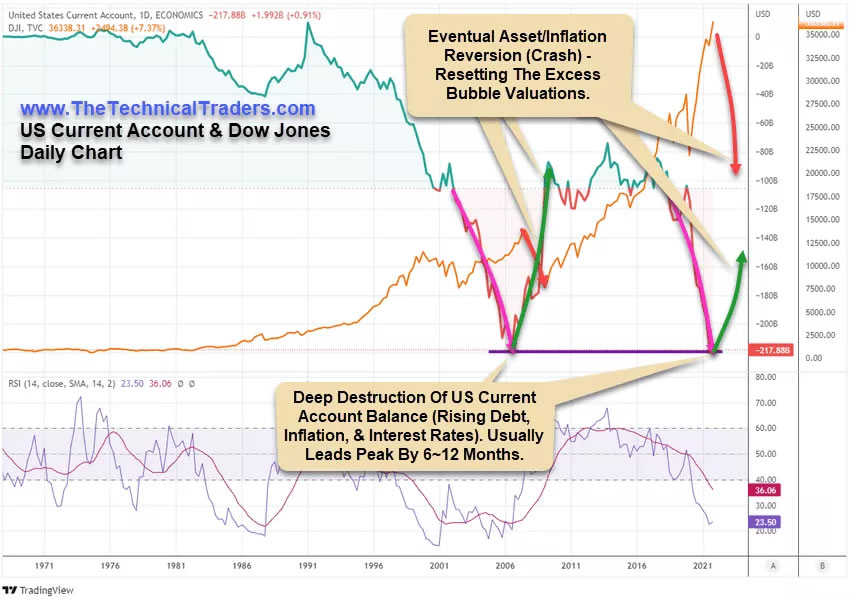
The research conducted by my team and I shows some interesting new data. In particular that the US Current Account data is very near to the levels reached just before the Global Financial Crisis (GFC) in 2006 (near -$218B). I consider this a very clear sign that the US economy, inflation, consumer engagement, and asset values have continued to hyper-inflate since the COVID-19 virus event.
The chart below highlights the US Current Account data and the Dow Jones Industrial (DJI) Average price data. Notice how the lowest level of the US Current Account data reached a deep trough (September 2006) about 12 months before the absolute peak in the DJI (September 2007). This time, the US Current Account trough formed in September 2021, and the peak in the DJI happened in December 2021 – only 3~4 months later.
The global markets have continued to consume cheap US Dollar liabilities over the past 10+ years as the US Fed kept interest rates very low for an extended period. Not only did this feed an extreme global speculative phase, but it also created an extreme credit/debt liability issue throughout the globe as rates increased. Debt holders are forced to roll debt forward at higher rates if they cannot pay off these liabilities completely – being over-leveraged. This same scenario is very similar to how the GFC started. Over-leveraged speculative trading in Mortgage-Backed Securities and other global assets.
Skilled Traders Saw This Problem Many Years In Advance
I’ve been informing my subscribers that an event like this was starting to take place throughout 2020 and 2021. Below, are some of the articles posted in our blog warning traders that the global markets were transitioning away from the endless bullish price trends from 2011 through 2021.
- May 23, 2021: US DOLLAR BREAKS BELOW 90 – CONTINUE TO CONFIRM DEPRECIATION CYCLE PHASE
- November 25, 2020: HOW TO SPOT THE END OF AN EXCESS PHASE – PART I
- September 17, 2021: DID THE GLOBAL MARKETS ROLLOVER IN APRIL/MAY 2021? WHAT NEXT? PART I
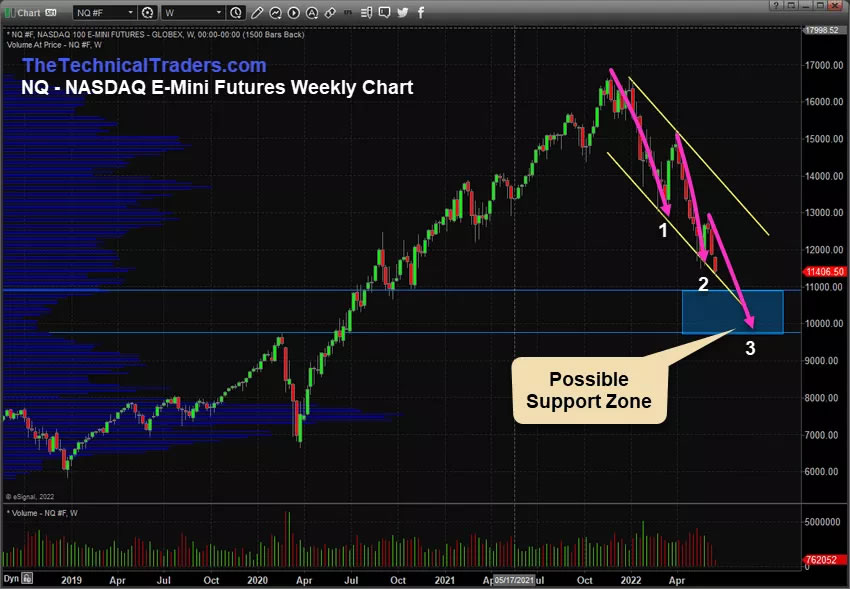
NASDAQ May Fall To $9,750 Before Attempting To Find Any Support
The Technology Sector is leading the downward price trend in the US major indexes. The NASDAQ could fall to levels close to $9,750~10,750 before attempting to find any real support.
Ultimately, the NASDAQ may fall to levels near the COVID-19 lows, near $6,500. But right now, the most logical support level exists just above the COVID-19 2020 highs.
I expect this new global price revaluation may last throughout the rest of 2022 and possibly carry into early 2023. It depends on what the US Fed does and how this event unfolds. If there is an orderly unwinding of excesses in the markets, we may see an extended decline as global expectations transition to new normal economic expectations. If a new crisis event blows a massive hole in the global economy, like in 2008-09, a very sudden decline may occur – shocking the global markets.
My research suggests the US Fed is far behind the curve and has allowed the excess speculative rally to carry on for too long. Global Central Banks should have been raising rates to moderate levels near the end of 2020 and in early 2021. Now, we have an excess phase bubble similar to the DOT COM and GFC events merged. We have an extreme Technology Bubble and an excess global credit/liability bubble.
If you have not already adjusted your assets to protect from downside risks, it’s time. When doing so, please consider the long-term risks of trying to ride out any extended downtrend in price. Are you willing to risk another -25% to -40% of your assets, hoping the global markets find a bottom soon?
WHAT STRATEGIES CAN HELP YOU NAVIGATE THE CURRENT MARKET TRENDS?
Learn how we use specific tools to help us understand price cycles, set-ups, and price target levels in various sectors. Also, learn how we identify strategic entry and exit points for trades. Over the next 12 to 24+ months, we expect very large price swings in the US stock market. The markets have begun to transition away from the continued central bank support rally phase and have started a revaluation phase as global traders attempt to identify the next big trends. Precious Metals will likely start to act as a proper hedge as caution and concern begin to drive traders/investors into Metals and other safe-havens.
Historically, bonds have served as one of these safe-havens. This is not proving to be the case this time around. So if bonds are off the table, what bond alternatives are there? How can they be deployed in a bond replacement strategy?
Sign up for my free trading newsletter so you don’t miss the next opportunity!
We invite you to join our group of active traders who invest conservatively together. They learn and profit from our three ETF Technical Trading Strategies which include a real estate ETF. We can help you protect and grow your wealth in any type of market condition. Click the following link to learn more: TheTechnicalTraders.com.
Chris Vermeulen
www.TheTechnicalTraders.com
Chris Vermeulen has been involved in the markets since 1997 and is the founder of Technical Traders Ltd. He is an internationally recognized technical analyst, trader, and is the author of the book: 7 Steps to Win With Logic
Through years of research, trading and helping individual traders around the world. He learned that many traders have great trading ideas, but they lack one thing, they struggle to execute trades in a systematic way for consistent results. Chris helps educate traders with a three-hour video course that can change your trading results for the better.
His mission is to help his clients boost their trading performance while reducing market exposure and portfolio volatility.
He is a regular speaker on HoweStreet.com, and the FinancialSurvivorNetwork radio shows. Chris was also featured on the cover of AmalgaTrader Magazine, and contributes articles to several leading financial hubs like MarketOracle.co.uk
Disclaimer: Nothing in this report should be construed as a solicitation to buy or sell any securities mentioned. Technical Traders Ltd., its owners and the author of this report are not registered broker-dealers or financial advisors. Before investing in any securities, you should consult with your financial advisor and a registered broker-dealer. Never make an investment based solely on what you read in an online or printed report, including this report, especially if the investment involves a small, thinly-traded company that isn’t well known. Technical Traders Ltd. and the author of this report has been paid by Cardiff Energy Corp. In addition, the author owns shares of Cardiff Energy Corp. and would also benefit from volume and price appreciation of its stock. The information provided here within should not be construed as a financial analysis but rather as an advertisement. The author’s views and opinions regarding the companies featured in reports are his own views and are based on information that he has researched independently and has received, which the author assumes to be reliable. Technical Traders Ltd. and the author of this report do not guarantee the accuracy, completeness, or usefulness of any content of this report, nor its fitness for any particular purpose. Lastly, the author does not guarantee that any of the companies mentioned in the reports will perform as expected, and any comparisons made to other companies may not be valid or come into effect.
Chris Vermeulen Archive |
© 2005-2022 http://www.MarketOracle.co.uk - The Market Oracle is a FREE Daily Financial Markets Analysis & Forecasting online publication.