


AI Tech Stock PORTFOLIO NAME OF THE GAME
Companies / AI Jun 29, 2022 - 10:21 PM GMTBy: Nadeem_Walayat

What's the name of the game?
Answer - To gain exposure to the Quantum AI tech stocks that are on an exponential trend trajectory. That is the name of the game, where today's 50% deviations form the highs in the likes of Nvidia and AMD will become invisible blips on the long-term charts in a few short years time. Though how many investors will be able to hold on for the big pay off? I suspect not many given that today's platforms induce a trader mindset in investors which is how the platforms have been designed to drum up lots of small commissions be it IKBR's 35 cents per trade or Free Trades 0.45% F/X fee. So I know what's going to happen after stocks have bottomed and start to rocket higher say by 30% to 50% many will start asking is it now time to sell? As they think they will be able to trade in and out of corrections.
Last year I made the mistake of selling too much! Selling 80% of my holdings was too much, yes a bear market was highly probable but one does not know for sure until it actually materialises and to what degree. Back when Nvidia was flying high as a kite above $300, writing that I expected it to fall to below $200 and possibly as low as $140 does not mean it was definitely going to happen until it actually happens!
AND THEN when itt did happen i.e. I saw Nvidia trade down to $154 one starts finding reasons for ever lower price targets to buy at which is the nature of bear markets where the bottom is always perceived as being so many points and months further away. Could Nvidia get to $100 a share? YES I cam make a strong case for that happening however that does not mean it WILL happen which is the risk one carries of failing to gain exposure.
In the midst of a bear market where one to's and fro's between scaling in and out, one is constantly bombarded with ever worsening fundamental data, it's as though the bear market GENERATES bad news and so it can be easy to forget the name of the game which is to ACCUMULATE EXPOSURE at deep discounts to the highs. Instead I see investors exiting their positions at 'break even' with a view to buying at a lower price as though it will be a done deal. That is a recipe for investing disaster!. As the bear market in Quantum AI tech stocks is living on borrowed time and the worst thing one can do is to see the bear market coming and then FAIL to capitalise upon it because one forgot the name of the game!
So whilst we continue to play a cat and mouse game with the stocks bear market do not make the mistake of forgetting the NAME OF THE GAME!
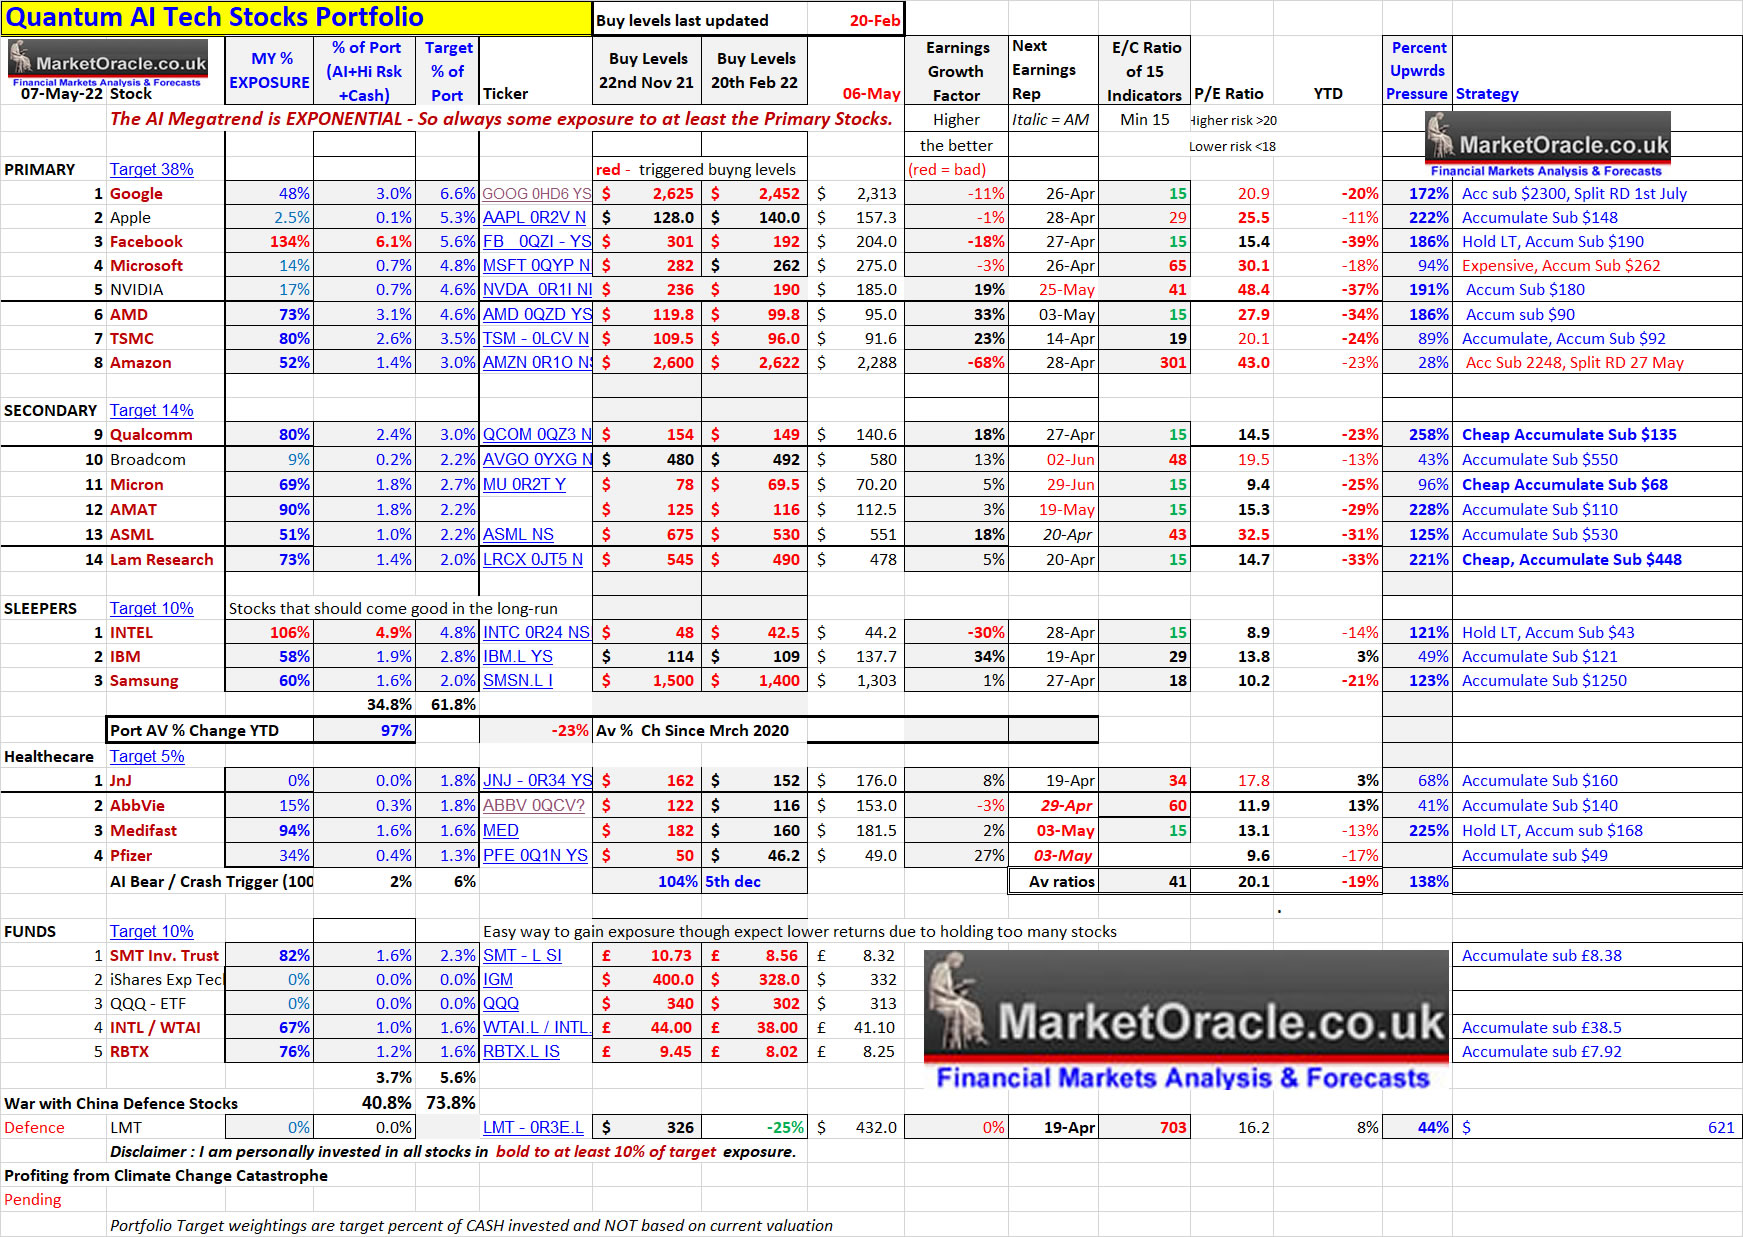
My portfolio currently stands at 65.8% invested. AI stocks 43.6%, high risk 22.2% and cash 34.2% so little changed from my last update. I have increased my max exposure targets for most of the AI tech stocks by about 5% to 10% hence drops in My % Exposure. Primary mechanism for determining accumulating and distributing are valuations. Where the current metrics used to determine valuations are the P/E, EC, EGF, EGF12M, and Fair value within the context of the underlying Quantum AI mega-trend. Supplemented by overall market technical and fundamental studies and several machine learning projects. Coupled with understanding to some degree of the nature of each corporations business activities which resolves in a portfolio with a high probability for exceeding the indices as has been the case since the portfolios public inception some 7 years ago (2016), with the original 6 stocks remaining constant.
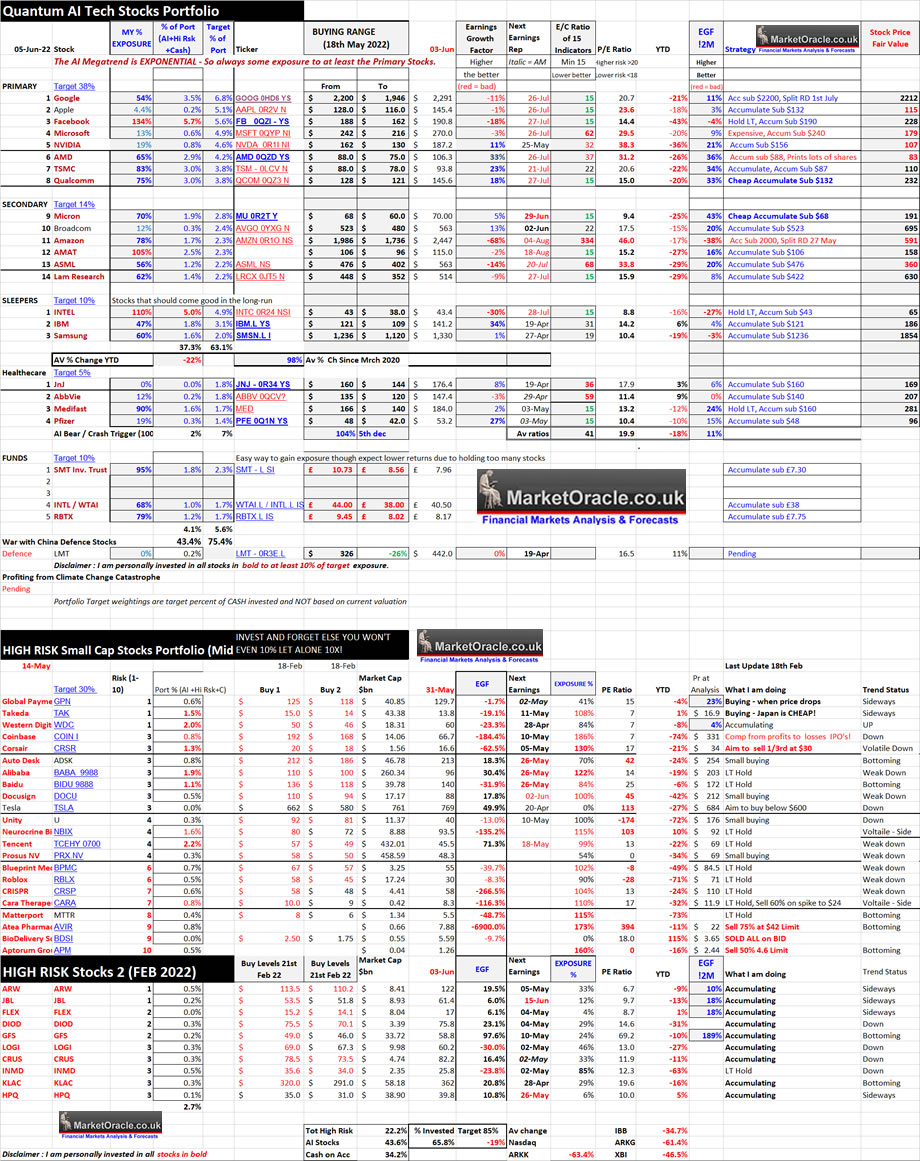
Table Big Image - https://www.marketoracle.co.uk/images/2022/Jun/AI-stocks-and-high-riskportfolio-big.jpg
AI stocks Table explained
The fundamentals for stocks CHANGE to varying degree following each earnings report, hence volatile price action around earnings reports. So one needs to keep upto speed on both the direction of travel and changes in the companies fundamentals.
P/E Ratio - The starting point is the the P/E ratio which is calculated by dividing the share price by the sum of the last 4 reported quarterly earnings per share which is readily available, though different sites use GAAP or non GAAP EPS, my preference is for non GAAP. Higher the PE the more expensive a stock, so the simple aim is to buy stocks for as low a PE as possible, but on it's own the PE is very limited.
Buying Range - High probability range for stocks to trade within to accumulate which replaces buying levels as what one buys at what level is determined by ones existing exposure i.e. if one has no exposure then one would accumulate towards the top of the range and then scale in should prices continue to decline down towards the bottom of the range.
Earnings Growth Factor (EGF) - Gives an indication of the direction of travel of earnings where the higher the positive percentage the better. Whilst a negative EGF warns of contracting earnings which should command a LOW P/E ratio to justify accumulation. EGF is calculated by dividing share price by latest EPS X4 then divided by current P/E ratio -1 for example (2X2)=4, 100/4 = 25, Current P/E 30, thus 30/25-1 = EGF +20%.
E/C Ratio - A formulae encompassing 15 inputs such as Price to Book, Price to Sales, P/E etc to better determine which stocks are cheap or expensive in relative terms where 15 is the minimum reading.
EGF12M - Similar to the EGF, however instead of the current quarter EPS X4 I am,using my own estimated EPS for the next 12 months to arrive at the EGF12M percent, as an indication of how strongly a stocks earnings could grow over the next 12 months.
Stock Price Fair Value - Based on the current PE ratio divided by the fair value PE ./ Ratio which is usually 18 for most stocks that is adjusted by the 12M EGF. i.e. Google PE 19.8 divided by (18* EGF12M) = 20 = 1 X share price $2186 = 2212. So one wants to buy a stock for as well below the fair value as possible, whilst buying above the fair value one is over paying to some degree for exposure to a stock. Note it is not a price target but an indicator of how cheap a stock price is compared to future earnings expectations.
MY % Exposure - Is how much I have invested in a stock as percent of the target amount i.e. if my target for a stock is £10k, and I have invested £5k then the exposure is 50%.
Port % (AI +Hi Risk+Cash) - My holding in each stock as a percent of AI stocks + High Risk stocks + Cash on account. So basically my public portfolio
Target % of - Is my target percent of portfolio (AI+ High risk + Cash).
BEST BUYS ( In order)
..............
This article is an excerpt from my recent exensive analysis of the state of the stocks bear market and more AI Tech Stocks Name of the Game, Climate Change Housing Market Impact and the Next Empires that was first been made available to patrons who support my work.So for immediate first access to ALL of my analysis and trend forecasts then do consider becoming a Patron by supporting my work for just $4 per month. https://www.patreon.com/Nadeem_Walayat.
Most recent analysis -
- The REAL Stocks Bear Market of 2022
- The Psychology of Investing in a Stocks Bear Market
- Dow 2022 Stock Market Trend Pattern
- AI Tech Stocks Name of the Game, Climate Change Housing Market Impact and the Next Empires
Whilst my recent in-depth analysis is - UK House Prices Three Trend Forecast 2022 to 2025, where I pealed away every layer of the UK housing market I could think of to arrive at a high probability of trend forecast, no following of the consensus herd here! Whilst completion of my extensive analysis of the US housing market is imminent.
UK House Prices Trend Forecast 2022 to 2025
THE INFLATION MEGA-TREND
WE HAVE NO CHOICE BUT TO INVEST IN STOCKS AND HOUSING
High Inflation Forecast for Whole of this Decade Due to Rampant Money Printing
Fed Inflation Strategy Revealed
Russian Sanctions Stagflation Driver
RECESSION RISKS 2023
UK Debt Inflation Smoking Gun
Britains' Hyper Housing Market
UK Population Growth Forecast 2010 to 2030
UK House Building and Population Growth Analysis
UK Over Crowding Ratio
Overcrowding Implications for UK House Prices
UK Housing Market Affordability
UK House Prices Real Terms Sustainable Trend
UK House Prices Relative to GDP Growth
UK House Prices Momentum Forecast
UK House Prices and the Inflation Mega-trend
Lets Get Jiggy With UK INTEREST RATES
Is the US Yield Curve Inversion Broken?
UK house Prices and Yield Curve Inversions
Interest Rates How High WIll they Go?
Work From Home Inflationary BOOM?
Formulating a UK House Prices Forecast
UK House Prices 2022 to 2025 Trend Forecast Conclusion
Peering into the Mists of TIme
Risks to the Forecasts
US House Prices Trend Forecast 2022-2024
So if you want immediate access to a high probability trend forecast of UK house prices, with US and global housing markets analysis to follow soon then do consider becoming a Patron by supporting my work for just $4 per month. https://www.patreon.com/Nadeem_Walayat.
My Main Analysis Schedule
- UK House Prices Trend Forecast - Complete
- US House Prices Trend Forecast - 85%
- Global Housing / Investing Markets - 60%
- US Dollar / British Pound Trend Forecasts - 0%
- Stock Market Trend forecast into End 2022 - 0%
- High Risk Stocks Update - Health / Biotech Focus - 0%
- How to Get Rich - 85%

- Gold and Silver Analysis - 0%
- State of the Crypto Markets
Again for immediate access to all my work do consider becoming a Patron by supporting my work for just $4 per month. https://www.patreon.com/Nadeem_Walayat.
And ensure you are subscribed to my ALWAYS FREE newsletter for my next in-depth analysis.
Your analyst BUYING the panic selling falling knives.
By Nadeem Walayat
Copyright © 2005-2022 Marketoracle.co.uk (Market Oracle Ltd). All rights reserved.
Nadeem Walayat has over 30 years experience of trading derivatives, portfolio management and analysing the financial markets, including one of few who both anticipated and Beat the 1987 Crash. Nadeem's forward looking analysis focuses on UK inflation, economy, interest rates and housing market. He is the author of five ebook's in the The Inflation Mega-Trend and Stocks Stealth Bull Market series that can be downloaded for Free.


 Nadeem is the Editor of The Market Oracle, a FREE Daily Financial Markets Analysis & Forecasting online publication that presents in-depth analysis from over 1000 experienced analysts on a range of views of the probable direction of the financial markets, thus enabling our readers to arrive at an informed opinion on future market direction. http://www.marketoracle.co.uk
Disclaimer: The above is a matter of opinion provided for general information purposes only and is not intended as investment advice. Information and analysis above are derived from sources and utilising methods believed to be reliable, but we cannot accept responsibility for any trading losses you may incur as a result of this analysis. Individuals should consult with their personal financial advisors before engaging in any trading activities.
Nadeem Walayat Archive |
© 2005-2022 http://www.MarketOracle.co.uk - The Market Oracle is a FREE Daily Financial Markets Analysis & Forecasting online publication.