Silent Killers of Stock and Bond Investors 50+
Stock-Markets / Investing 2023 Feb 20, 2023 - 09:01 PM GMTBy: Chris_Vermeulen
Recently I was shocked after speaking with five different investors on the phone. These investors have been involved in the markets for many years, and they trade their accounts. Surprisingly, not a single one of them knew what drawdowns were, as there are two types. In short, it is how we gauge an overall investment strategy’s risk level so you know if a given approach fits within your risk tolerance.
I did a survey several years ago that still blows my mind because the results were so backwards and frustrating. To this day, I’m experiencing the same thing with traders and investors, so I want to talk about it here – drawdowns and what you may not know about them.
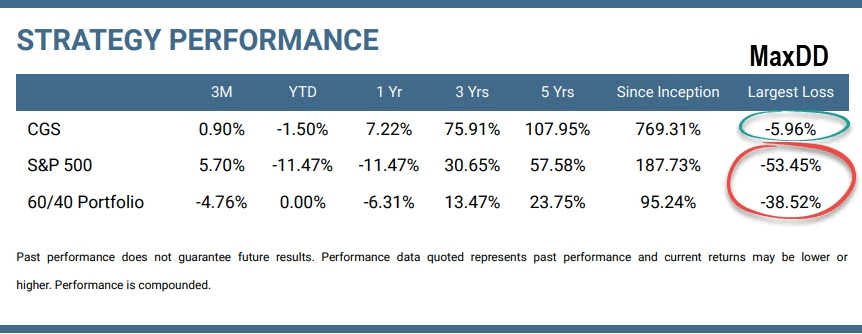
A drawdown measures how much an investment or trading account is down from its highest point. It is used to quantify the extent of loss suffered by an investor or trader during a period of market decline. A drawdown is expressed as a percentage. Also, the maximum drawdown (MaxDD) is the largest percentage drop from the account’s highest point to its lowest point over the life of the strategy, which in laymen’s terms, is the largest loss.
Drawdowns are a part of investing and trading and can significantly impact an investor’s financial health and retirement lifestyle, but it takes this type of self-discipline for success.
Large drawdowns can take years to recover, which can be devastating for investors nearing retirement or already retired. This is because there is a second type of drawdown: the time it takes to recover from the value drawdown. When an investor experiences a significant drawdown, it can take years for their account to recover to its previous level, which can delay or destroy one’s retirement plans.
Max Drawdown Comparison for Buy-and-Hold vs. Tactical Investing
The traditional buy-and-hold method of holding stocks and bonds has a significantly higher drawdown compared to a strategy that manages positions and risk, like the CGS method.
I work with advisors and money managers of all types, and they all say the same thing: investors start to get nervous and panic when their account falls roughly 8%. This begs the question of WHY do most firms like Fidelity and Schwab, and advisors in general, force the buy-and-hold strategy on investors when they know the risks these strategies incur? Don’t get me started. That’s a topic for another time, which Forbes did a write up on this a while back, which I will share in a future article. But Investors have Stockholm Syndrome because of the torture which the financial industry has put them through for so long, and that what they think is normal, isn’t.
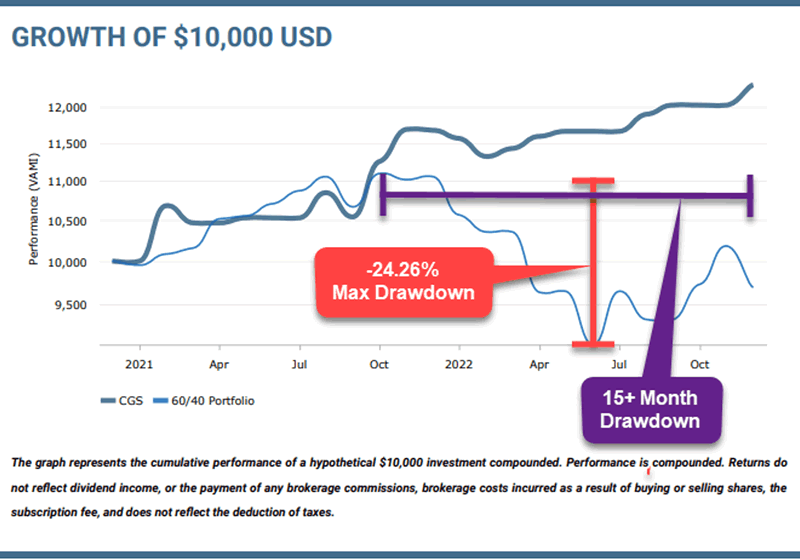
Two Types of Drawdowns – Value and Time
The graph below shows these two types of drawdowns, which occurred during the 2021 market peak, and 2022 market trough of the buy-and-hold stock/bond portfolio. One of the things investors do not realize is that when you lose a large amount of money during a drawdown, it requires a much larger gain to recover.
Also, if they suffer a 15-month drawdown (wasted time), it requires twice that time to recover because they missed out on the gains during that drawdown year, and then you need to earn the gains for an additional year, therefore, drawdowns cut twice as deep as most investors realize.
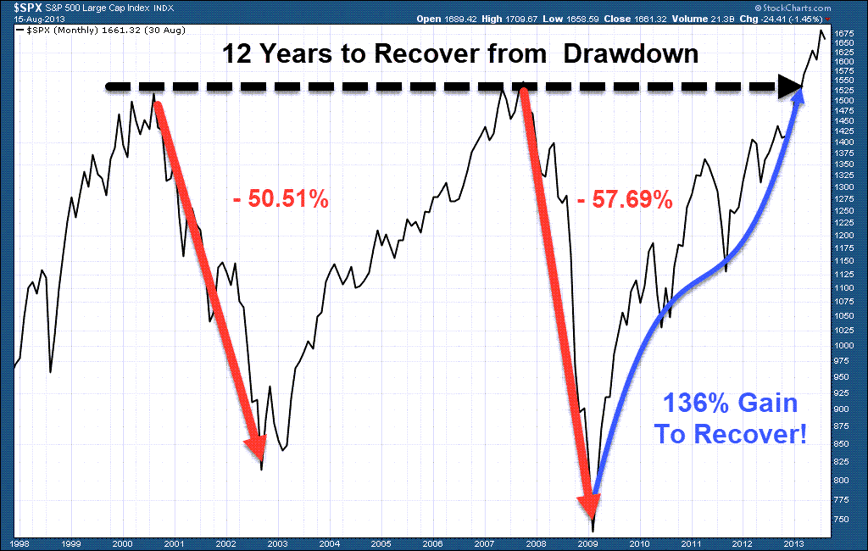
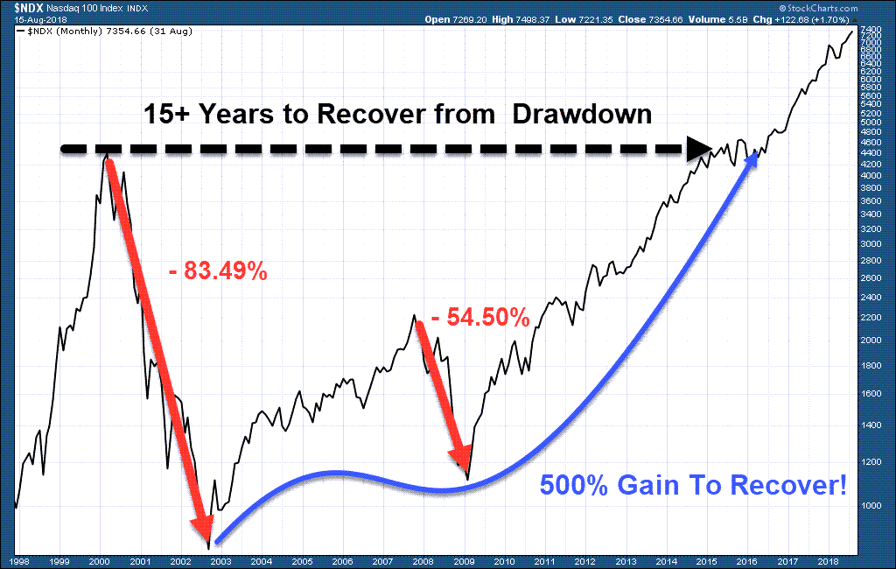
The traditional buy-and-hold investing strategy, which holds a diversified basket of assets, is a high-risk strategy for investors over 50. This is because the system is vulnerable to large drawdowns, which can significantly impact an investor’s financial health. In addition, the time it takes to recover from a large drawdown, the type which comes after a bear market, on average takes 3-7 years to recover, but note, there have been recoveries lasting 12 and even 15 years in the case of the 2000 tech bubble. Any delay in growth pushes an investor’s retirement further out, which can force them to downgrade their retirement lifestyle significantly without knowing it until its too late.
I talked about investors need to be prepared for another 37% bear market crash, and how to avoid it in this 39-minute interview.
S&P 500 Index
This chart is a perfect example of how an investor who buys and holds positions can suffer from large value drawdowns and massive recovery time drawdowns.
Nasdaq Tech Bubble and Growth Stock
Unfortunately, most investors are lured toward more risky assets, known as tech or biotech stocks. These are known as growth stocks, and the issue with buying and holding these types of companies during a bear market is that they fall the most and take the longest to recover, but because they are called growth stocks, most investors think they are the best investments.
Drawdowns Kill Investors In Three Different Ways
A research report found that between 2008 and 2009 alone, there were over 6500 suicides directly related to the drop in equity value. I know what will happen to you if this does not open your eyes to how dangerous bear markets and drawdowns are. Some investors turn a blind eye to a bear market and think they can simply just ride it out, but in most cases, the pain of loss will get so extreme they end up doing something they wish they didn’t. Unfortunately, I have come to a conclusion, that some people just have to learn the hard way, and there isn’t much I can do about it other than try to help. One thing most investors don’t know is how their brain functions – thinks, feels, processes and reacts. Knowing your investment personality is critical for long-term success.
My focus is to help those who have a head on their shoulders and realize they need help to protect and grow their wealth during the most critical phase of their life – near retirement or retired.
Aside from the emotional damage, reduced account size, and delay of retirement, investors have to work much longer as seniors and reduce their quality of life. Don’t get me wrong, the diversified buy-and-hold investment strategy can work very well for young investors, but it is a high-risk gamble on your golden years if you are over 50.
Tactical Investing – Consistent Growth Strategy (CGS)
Tactical investing is an approach to investing and trading that can help investors avoid large drawdowns in both value and time to recover. It involves selling underperforming assets and reinvesting the proceeds into assets that are rising in value. This strategy allows investors to avoid holding falling positions and take advantage of market trends. In addition, by following a proven asset hierarchy list, investors can substantially reduce drawdowns through positions with lower volatility.
Technical trading signals provide clarity on market direction and risks by removing the guesswork from trading. Using these signals helps investors control risk by following price trends, holding positions when assets are rising, and quickly exiting underperforming positions.
Technical trading systems based on ETF signals provide proven, repeatable processes that introduce consistency, control, and capital preservation. Based on technical analysis rules rather than fundamental predictions and the old buy-and-hope strategy, active investors who follow the strategy rules gains control of their emotions, particularly FOMO and hindsight.
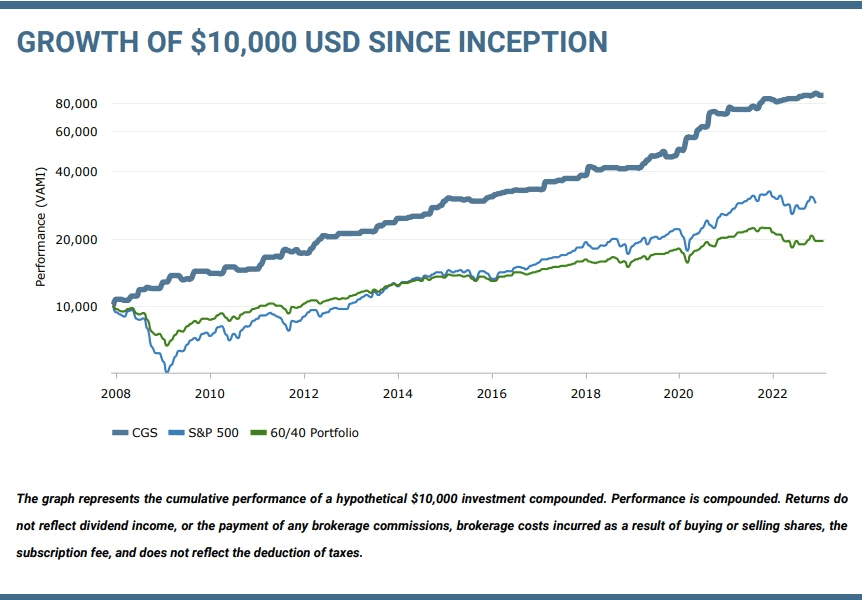
In conclusion, drawdowns are a natural part of investing and trading, but they can significantly impact an investor’s financial health. Large drawdowns can take years to recover, which can be devastating for investors nearing retirement. The traditional buy-and-hold investing strategy is vulnerable to large drawdowns, particularly for investors over 50. Tactical investing is an approach to investing and trading that can help investors avoid large drawdowns in value and time to recover. By following a proven asset hierarchy list and using technical analysis signals, investors can substantially reduce drawdowns through positions with lower volatility, nearly double their annual returns, and retire sooner than they thought possible with ETFs.
My team and I are available to help investors safely navigate both bull and bear markets using the ETF Consistent Growth Strategy. If you have any questions or would like to learn more, please don’t hesitate to reach out.
If you enjoyed this article, please share it with others, and be sure to join my free newsletter and have more articles like this delivered to your inbox.
Chris Vermeulen
www.TheTechnicalTraders.com
Chris Vermeulen has been involved in the markets since 1997 and is the founder of Technical Traders Ltd. He is an internationally recognized technical analyst, trader, and is the author of the book: 7 Steps to Win With Logic
Through years of research, trading and helping individual traders around the world. He learned that many traders have great trading ideas, but they lack one thing, they struggle to execute trades in a systematic way for consistent results. Chris helps educate traders with a three-hour video course that can change your trading results for the better.
His mission is to help his clients boost their trading performance while reducing market exposure and portfolio volatility.
He is a regular speaker on HoweStreet.com, and the FinancialSurvivorNetwork radio shows. Chris was also featured on the cover of AmalgaTrader Magazine, and contributes articles to several leading financial hubs like MarketOracle.co.uk
Disclaimer: Nothing in this report should be construed as a solicitation to buy or sell any securities mentioned. Technical Traders Ltd., its owners and the author of this report are not registered broker-dealers or financial advisors. Before investing in any securities, you should consult with your financial advisor and a registered broker-dealer. Never make an investment based solely on what you read in an online or printed report, including this report, especially if the investment involves a small, thinly-traded company that isn’t well known. Technical Traders Ltd. and the author of this report has been paid by Cardiff Energy Corp. In addition, the author owns shares of Cardiff Energy Corp. and would also benefit from volume and price appreciation of its stock. The information provided here within should not be construed as a financial analysis but rather as an advertisement. The author’s views and opinions regarding the companies featured in reports are his own views and are based on information that he has researched independently and has received, which the author assumes to be reliable. Technical Traders Ltd. and the author of this report do not guarantee the accuracy, completeness, or usefulness of any content of this report, nor its fitness for any particular purpose. Lastly, the author does not guarantee that any of the companies mentioned in the reports will perform as expected, and any comparisons made to other companies may not be valid or come into effect.
Chris Vermeulen Archive |
© 2005-2022 http://www.MarketOracle.co.uk - The Market Oracle is a FREE Daily Financial Markets Analysis & Forecasting online publication.


