Leading Economic Indicator attacked for signaling sluggish GDP growth
Economics / US Economy Apr 10, 2007 - 06:47 PM GMTBy: Paul_L_Kasriel
When The Facts Change, I Change My Model - What Do You Do?
On March 22, I published a commentary entitled" US Recession Imminent? Both the Leading Economic Indicators and the KRWI are Flashing Warning Signs ". The LEI refers to the index of Leading Economic Indicators published by the Conference Board. The KRWI (Kasriel Recession Warning Indicator) is something I happened on in my independent research.
In that March 22 commentary, I wrote:
"The LEI might be termed the ultimate Rodney Dangerfield of economic statistics - it can't get no respect. The LEI often is referred to derisively by mainstream Wall Street economists as the index of Mis leading Indicators. I suppose that if there were an indicator that gave consistently better advance warnings of the onset of recessions and recoveries than one's my "proprietary" GDP forecasting model, I would not look kindly on this indicator either for fear of having my forecasting job replaced by a Conference Board press release. And although I might publicly deride the LEI, I would privately incorporate it into my forecasts. Judging from how poorly consensus economic forecasts consistently fail to anticipate cyclical turning points, it looks as though many macroeconomic forecasters are either ignorant of how well the LEI outperforms them or are just plain stupid."
I must have hit a raw nerve because one economist, Michael Lewis, president of Free Market Inc., penned a diatribe excoriating the LEI. One of his major criticisms of the LEI is that it is a work in progress. That is, over time, its components have changed. For example, in the 1980s, one of its components was an index of economically-sensitive materials prices. In later years, the LEI was revamped, dropping this price index and adding the spread between the Treasury 10-year bond yield and the federal funds rate (long-short spread, or 'the spread'). So, this irate economist is quite correct - today's LEI is not your father's LEI.
But is that such a bad thing? According to legend, when John Maynard Keynes was challenged about a change in his views on something economic, he responded along the lines that when the facts warranted a change in view, he changed his view. He then queried the rival: "What do you do?" So, if the Conference Board thinks that it has come up with a better "mousetrap," should it keep using the less efficient one or introduce the new one? Would a rational economist continue to use a forecasting model that had become more error prone if he could tweak it such that it better explained past data, realizing, of course, that explaining past economic behavior is no guarantee that future behavior will conform? But if one can't explain the past behavior of the economy, what confidence would anyone have in him to forecast future behavior?
Mr. Lewis appeals to authority in denigrating the LEI. That authority is none other than Alan Greenspan. Mr. Lewis cites FOMC meeting transcripts of 2000 when then Fed Chairman Greenspan, in the words of our irate economist, "mocked the index's use of revised/benchmarked data and periodic major revamps." I don't know what the 2000 version of the LEI was doing "real time" - evidently it must have been pointing toward a recession or Greenspan would not have brought up the subject -- but I do know that the current version on a quarterly average basis had gone from a year-over-year change of plus 4.1% in Q4:1999 to minus 0.6% in Q4:2000.
I know that the peak in that business expansion occurred in March 2001. I also know that the FOMC was biased toward raising the fed funds rate through November 2000, did a 180 at the December 10, 2000 meeting and, in a special telephone conference on January 3, 2001, dropped the fed funds rate by 50 basis points. Obviously, the slowdown in economic growth in late 2000 caught Chairman Greenspan by surprise. Perhaps if he had spent less time "mocking" the LEI and more time observing its behavior, he would have cut the funds rate sooner and avoided the recession of 2001. A reading of the August 21, 1990 FOMC transcript, August being the month after that business expansion had peaked and, therefore, the month the economy entered a recession, has Chairman Greenspan stating "that those who argue that we are already in a recession I think are reasonably certain to be wrong..." Again, I don't know what the 1990 version of the LEI was doing, but the 2007 version of the LEI on a quarterly average basis was down year-over-year starting in the second quarter of 1989 ! Regardless of what the prior versions of the LEI were signaling in 1990 or 2000, Greenspan was hardly prescient with regard to the occurrence of recessions. So, he would not be the authority to which I would be appealing to denigrate the LEI. We all try to learn from our mistakes, perhaps even Alan Greenspan. To wit, a few weeks ago, Greenspan put the odds of a recession occurring this year at 30%. Maybe Greenspan, instead of mocking the LEI today, is embracing it?
I am not a shill for the Conference Board. I have tested the ten components of the LEI for their leading indicator characteristics. I have found that a number of them appear to be more akin to coincident indicators than leading indicators. Of those components that do lead, some lead more than others. I am not endorsing the Conference Board's weighting methodology. I realize full well that the LEI has evolved more along empirical lines than theoretical ones, although some of its components do have theoretical underpinnings. All I was saying is that in its present form, the LEI has done a good job of foreshadowing past recessions -considerably more than can be said for the consensus forecasts of economists. As the irate economist points out, economic cycles are like fingerprints - no two are alike (my words, not his). Perhaps the LEI will give a false signal this time. But does Mr. Lewis know this a priori ? It is easy to criticize something. But what does Mr. Lewis offer that is superior to the LEI?
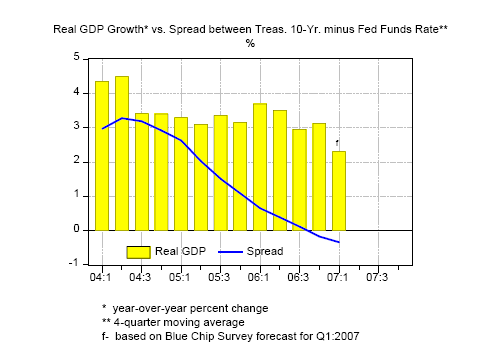
Mr. Lewis seems obsessed with trashing one of the components of the LEI, the long-short yield spread. Just because the spread has gone negative and the economy presumably has not yet entered a recession is no reason to ignore the primary message that was being sent by it - namely that economic growth was likely to slow. In this current cycle, the spread hit a high of 3.28 percentage points (328 basis points) on a four-quarter moving average basis in Q2:2004. As of Q1:2007, the spread had narrowed to minus 34 basis points. On a year-over-year basis, real GDP growth peaked at 4.49% in Q2:2004 and has slowed to 2.3% in Q1:2007 based on the Blue Chip Survey consensus real GDP forecast for the first quarter of this year. All of this can be seen in Chart 1. The narrowing in the spread had been anticipating slower real GDP growth - exactly what has occurred.
Chart 1

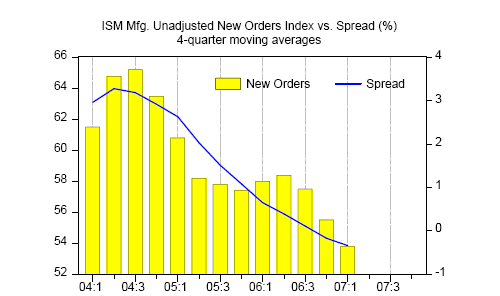
Don't trust the Commerce Department's measurement of real GDP? What about the ISM manufacturing new orders index? This index, when devoid of seasonal adjustments, never gets revised. Chart 2 shows a similar qualitative relationship between the spread and the ISM manufacturing new orders index - that is, a narrowing spread has anticipated slower growth in manufacturing activity.
Chart 2

In my March 22 commentary I mentioned, in addition to the LEI, another indicator that had in the past been a reliable harbinger of recessions and was currently on the verge of sending a recession signal. That indicator, which I modestly referred to as the Kasriel Recession Warning Indicator (KRWI) is simply, but not necessarily simplistically, the combination of a negative spread between the Treasury 10-year yield and the fed funds rate - the same spread that is a component of the LEI - and the year-over-year contraction in the price-adjusted or real monetary base. The monetary base consists of reserves created by the Fed for the banking system and the coin and currency held by the public.
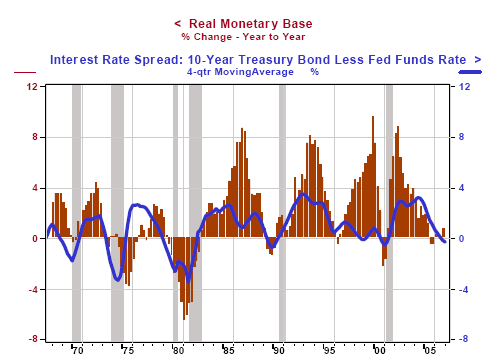
There are different variations of the monetary base. The variant I chose is unadjusted - unadjusted for seasonal variation and unadjusted for changes in bank reserve requirements. I like variables that do not get revised such as the unadjusted monetary base and the spread. Now the CPI, the price index I used to calculate the real monetary base unfortunately does get revised. And, the CPI I used to calculate the real monetary base in my March 22 commentary was not a consistent series. So, in the interest of "purity," I have recalculated the real monetary base using what I believe to be a consistent CPI series for the years 1967 through 2006. The series is the CPI-U-X1 (published and maintained by Haver Analytics), which uses the rental equivalence approach to housing costs throughout. Chart 3 shows the real monetary base series using this consistent CPI-U-X1 series along with the spread. The shaded areas are periods of recession as designated by the NBER.
Chart 3

Remember, the KRWI signals a recession when both the year-over-year change in the quarterly average real monetary base is negative and the four-quarter moving average of the spread is negative. By using the consistent CPI-U-X1 series, the year-over-year change in the real monetary base did not go negative in the cycle leading up to the 1969-1970 recession until Q1:1970. The peak of economic activity in that business cycle occurred, according to the NBER, in December 1969. So, if you want to get picky, the KRWI did not send a recession warning in that cycle until the quarter in which the recession began.
The LEI-hating economist probably also can come up with numerous reasons as to why the KRWI is an irrelevant leading indicator of recessions. But one criticism that he can not level against it is that today's KRWI is different from the one that predicted the 1975, the 1980, the 1990 and the 2001 recessions. The KRWI is the same today as it was in 1967. Moreover, the KRWI is one of those so rare examples of a situation where a "beautiful" theory is not spoiled by some "ugly" facts. (For the theory and the facts underlying the KRWI, see The Econtrarian, March 16, 2007, " The Inverted Yield Curve -- Is It Really Different This Time? ").
Now, it certainly is possible that the LEI and the KRWI may issue a false recession signal in the coming months. But I don't think that whether or not the economy slips into a recession this year is the most important information either indicator provides. Rather, both indicators signaled in advance that economic growth would slow significantly. My below-consensus forecasts were guided by these "irrelevant" indicators. Moreover, both indicators suggest that resurgence in economic growth is not imminent. If that is how economic events unfold, then the Fed's next change in the federal funds rate is more likely to be a cut than an increase.
Continued sluggish economic growth and a cut in the federal funds rate would seem to have considerably different investment implications than a rebound in growth and an increase in the federal funds rate. I don't know what Mr. Lewis had been forecasting or is now forecasting. But given his vehement reaction to my March 22 commentary, I suspect he was on the wrong side of the real GDP data published after Q1:2006. Because I prefer weaker competition to stronger, I hope he continues to ignore the LEI.
*Paul Kasriel is the recipient of the 2006 Lawrence R. Klein Award for Blue Chip Forecasting Accuracy
By Paul Kasriel
The Northern Trust Company
Economic Research Department - Daily Global Commentary
Copyright © 2007 Paul Kasriel
Paul joined the economic research unit of The Northern Trust Company in 1986 as Vice President and Economist, being named Senior Vice President and Director of Economic Research in 2000. His economic and interest rate forecasts are used both internally and by clients. The accuracy of the Economic Research Department's forecasts has consistently been highly-ranked in the Blue Chip survey of about 50 forecasters over the years. To that point, Paul received the prestigious 2006 Lawrence R. Klein Award for having the most accurate economic forecast among the Blue Chip survey participants for the years 2002 through 2005.
The opinions expressed herein are those of the author and do not necessarily represent the views of The Northern Trust Company. The Northern Trust Company does not warrant the accuracy or completeness of information contained herein, such information is subject to change and is not intended to influence your investment decisions.
© 2005-2022 http://www.MarketOracle.co.uk - The Market Oracle is a FREE Daily Financial Markets Analysis & Forecasting online publication.


