


US Economic Output vs Money Supply
Economics / Money Supply Dec 26, 2008 - 05:39 PM GMTBy: Eric_deCarbonnel

 Whether prices rise or fall depends on what is happening with a nation's economic output and money supply. If one is growing/shrinking proportionally faster than the other, you get inflation/deflation. For example, if the money supply is growing faster than economic output (what happens during normal economic times), you get inflation.
Note: the velocity of money is also important in determining prices, but I am choosing to ignore it right now because I already covered it in how deflation creates hyperinflation .
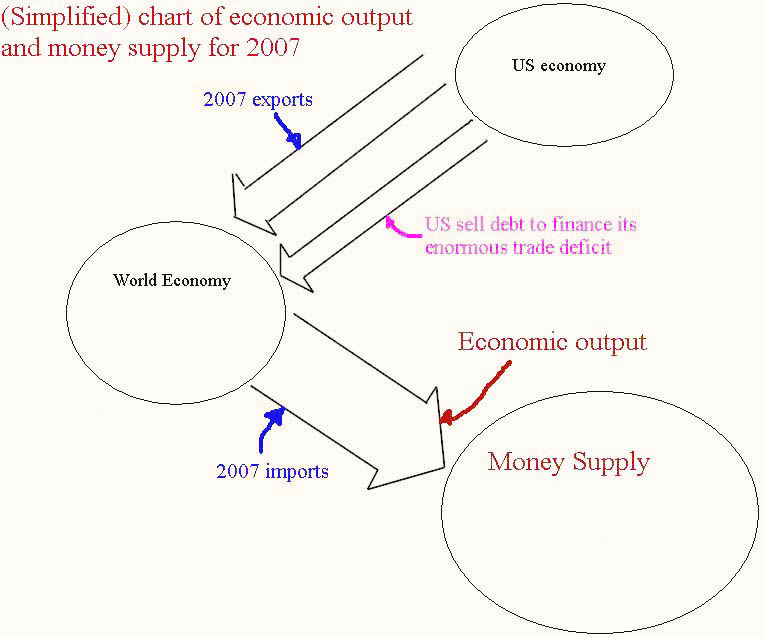
(Simplified) Charts of US economic output and money supply
Demand for the big ticket durable and capital goods produced by "developed" nations is plummeting much faster then demand for cheap consumer imports, which is causing trade deficits to widen . As a result, economic output in the US and other "post-industrial" nations is set to fall at a much faster pace than the deflating money supply. To illustrate this point, I made two charts to show what would happen if the world stops financing our trade deficit.
For 2007:
Rough estimate for 2009:
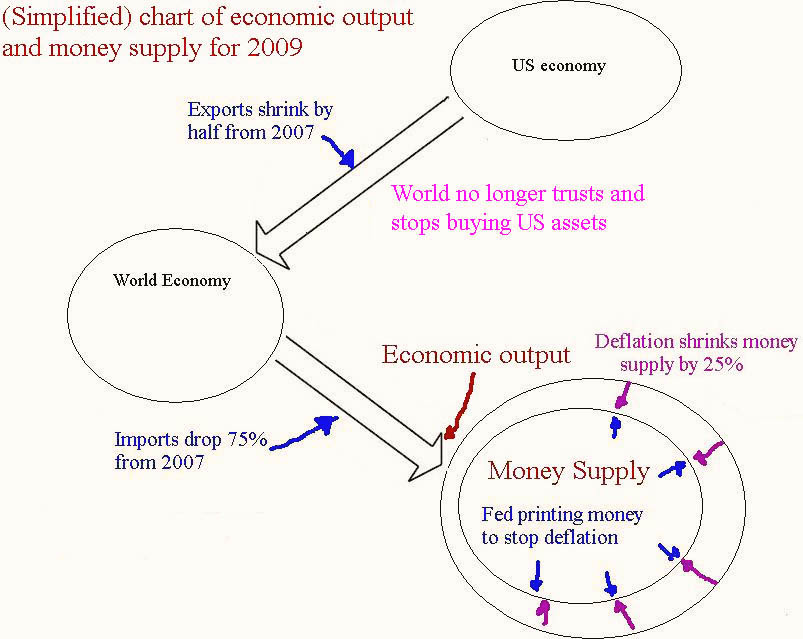
If economic output shrinks by 75% and the money supply shrinks 25%, you get inflation as there will be more dollars for each unit of economic output.
Imports are going to shrink next year because the value of the dollar is going to fall against foreign currencies as the world stops loaning us money. Already, nations like China are moving away from the dollar . Expect a shortage of goods as the price of imports skyrockets (the same thing which happened to Iceland ).
Two final notes:
Chart of 2009 is inflation adjusted
The dollar value of imports in 2009 is likely to be incredibly high because of (hyper)inflation, but the quantity of imported goods is going to fall drastically. The illustration of 2009 above focuses on the falling quantity of imported goods.
Charts do not include effects of a dollar panic
In reality, foreign investors will do more than stop lending us money: they will start selling their enormous dollar holdings. This means the dollar is going to weaken far more than what the charts suggest.
I hope these charts make things clearer.
By Eric deCarbonnel
http://www.marketskeptics.com
Eric is the Editor of Market Skeptics
© 2008 Copyright Eric deCarbonnel - All Rights Reserved
Disclaimer: The above is a matter of opinion provided for general information purposes only and is not intended as investment advice. Information and analysis above are derived from sources and utilising methods believed to be reliable, but we cannot accept responsibility for any losses you may incur as a result of this analysis. Individuals should consult with their personal financial advisors.
Eric deCarbonnel Archive |
© 2005-2022 http://www.MarketOracle.co.uk - The Market Oracle is a FREE Daily Financial Markets Analysis & Forecasting online publication.