


Weekly Gold and Silver Technical Analysis Report - 7th May 2007 - Technically Precious with Merv
Commodities / Gold & Silver May 07, 2007 - 09:06 AM GMTBy: Merv_Burak

Gold just can't seem to make up its mind where it wants to go. I'll tell it – GO HIGHER – but will it listen?
GOLD
Since last showing the long term P&F chart in the 13 April 2007 commentary nothing has changed. No new X to suggest a further advance and no O s to indicate a reversal of direction. This either shows that from a long term perspective gold has reached somewhat of a stalemate or that the latest P&F unit criteria was too large. With $15 units and a 2 unit reversal criteria gold has a $45 range within which to move without affecting the P&F . This is what it has been doing for the past three weeks now. I don't expect this stalemate to last too much longer, but who knows?
As for the usual suspects, the week's action in gold all took place above its long term moving average line and the line slope is still positive. The action continues to take place inside that up trending channel shown last week (and below) and is expected to remain inside the channel for some time yet, unless we have some real vicious moves. As for momentum, that's the real cautionary indicator. First, the various price momentum (strength) indicators that I look at are all in their positive zones and will remain so for at least a few weeks. However, the trend of these indicators is troubling. A year ago with the price of gold at almost the same level as today the long term RSI was at the 76% level.
Today, the RSI is at 58%, much lower. My own Price Oscillator is even worse. Last year it was at the 7% mark and now only at the 2.5% mark. Although the absolute values may not mean much to most observers the difference in the values, with price at about the same level, is disturbing. Since late last year the slope of the momentum indicators has become very weak. Although still sloping upwards the magnitude of the slope suggests a weak underlying price strength. Looking at the various stock Indices the momentum indicators are even weaker. See the appropriate sections later in the commentary.
I must still go with the indicators and consider the long term as BULLISH but one must remain on the watch for a possible reversal ahead.
INTERMEDIATE TERM
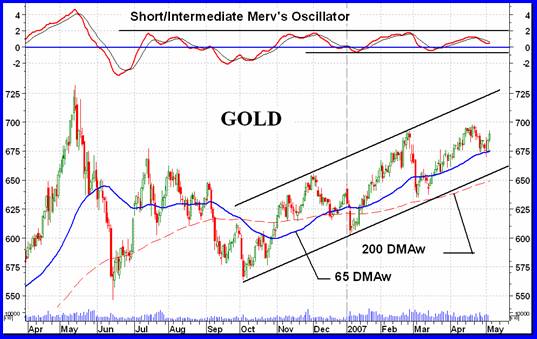
The difference in the price trend of gold versus its strength trend can be seen in the chart. My short to intermediate term price oscillator shows, at best, a lateral trend in the strength while the price trend has been generally slightly to the up side. Since the beginning of the year we have had higher highs and higher lows in the price action while the momentum indicator has been making equal lows and slightly lower highs. I have been mentioning this divergence for some time now but it continues. Sooner or later the two, price and momentum, have to get in gear. That will then tell us the true strength direction. In the mean time we go with what we have.
Both price action and momentum are still in the positive. Price above a positive moving average and momentum in the positive zone. The intermediate term RSI is a little stronger than my Price Oscillator but that is only a small level of degree. The small rally this past week still does not register very much in the intermediate term. However, the indicators are still positive so the prognosis on the intermediate term is still BULLISH.
SHORT TERM
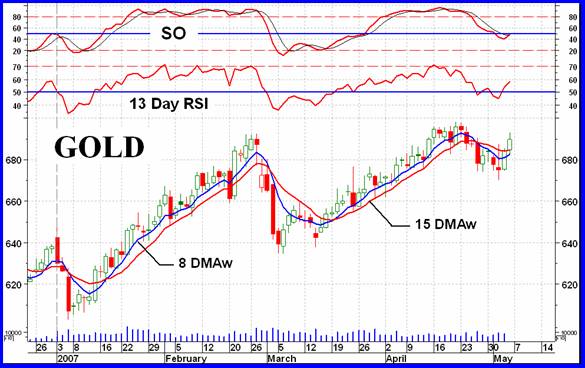
Friday's action seems to have changed the short term outlook for the better. A close above the moving average line (15 DMAw) and the line turning up are major short term events. Momentum going positive just confirms the turn. Although a lot more downside was expected last week we go with the flow and don't argue.
IMMEDIATE TERM
As for the next day or two, that too looks to be to the up side. Close above the moving average line (8 DMAw), the line turning up and the Stochastic Oscillator closing above its trigger line are all positive trend indicators. I would be cautious if it should close below $684. That might put the trend once more into the down side.
NORTH AMERICAN GOLD INDICES
Well, once again it's the turn of AMEX Gold BUGS Index ( HUI ) to be looked at.
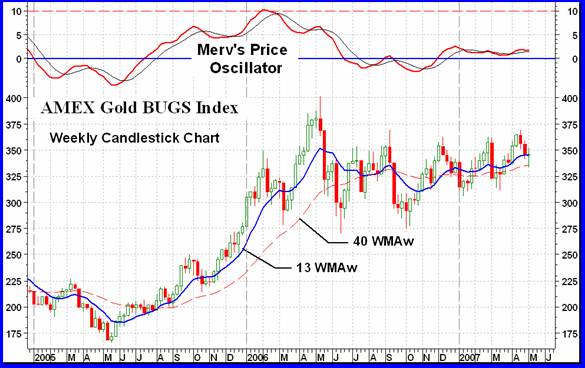
Unlike most other Indices the AMEX Gold BUGS Index ( HUI ) most closely represents what's happening under the radar screen in performance. All of my various gold Indices (except for the Gamb-Gold Index) show a momentum indicator that has been flat or even moving lower for several months now, even as the Indices themselves have been moving higher.
The HUI is one Index where the Index itself is showing this lateral motion. Here, both the Index and the momentum indicator are in agreement. But that still doesn't get around the fact that both are in agreement but for a neutral market trend, rather than a bullish trend. One would be looking for some sharp and positive moves to get the Index above the 375 level and the indicator above the 3.0% level for a new bull move to take hold. Otherwise, it might just deteriorate into a new bear move.
The Merv's Price Oscillator shown here is very much like the MACD indicator except that this indicator is based upon percentage changes in price rather than based upon actual price changes. The difference is significant. Check out a weekly chart of the AMEX Gold BUGS Index with a MACD. There is a significant difference in the warning given at the top of the trend in May of 2006. We have a serious negative divergence in the Merv's indicator while the MACD was still confirming the new Index high by making a new high itself (no warning). All indicators have their uses. All indicators have their shortcomings. It is VERY instructive to REALLY understand what an indicator is telling you and what its shortcomings are before blindly using it.
MERV'S PRECIOUS METALS INDICES
The table of Precious Metal Indices shows most Indices closed on the up side during the week although most only by a fraction of a percentage. The Composite Index itself barely moved. Its trend is still very gently to the up side but the trend of the momentum indicators is lateral to slightly negative, albeit all in the positive zone. The Index itself is still very close to its previous May 2006 high but not yet decisively above it. The action continues to suggest a potential bearish double top pattern.
MERV'S GOLD & SILVER 160 INDEX
The average gain for the universe of 160 stocks was 1.5% on the week. Not much but enough. The trend is still towards the up side with the Index above its moving averages and momentum indicators still in their positive zones. Not much real change lately but that's better than serious negative change.
To go along with the positive Index we have a majority of component stocks closing on the up side with 59% advancing and 35% declining. As for speculation, there were no stocks making it into my arbitrary plus/minus 30% weekly move category so wild speculation is still being held back for a later day. As for the summation of individual stock ratings this past week, that changed very little, if at all. We are still at a weak 50% BEAR for the short term, NEUTRAL for the intermediate term with neither bull nor bear and 62% BULL for the long term.
Basically a holding market waiting for a move on another day.
MERV'S QUAL-GOLD INDEX : MERV'S SPEC-GOLD INDEX : MERV'S GAMB-GOLD INDEX
All three of the gold sectors moved higher during the week with the Qual-Gold at the bottom with a 0.1% gain and the Spec-Gold at the top with a 2.1% gain. The Gamb-Gold was in the middle with a gain of 1.1%. The gambling variety of stocks continue to be the performers over the past several months but even here the trend seems to be getting weaker
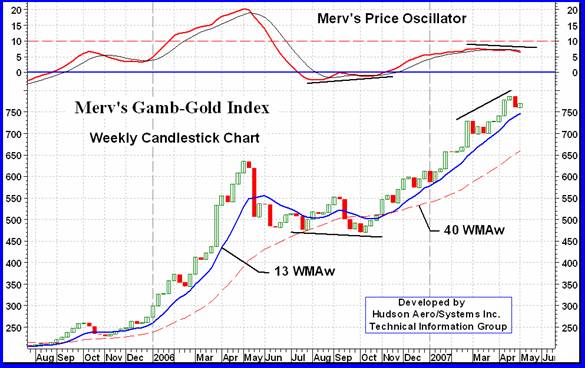
I've shown this chart many times before as it shows the AVERAGE performance of 30 gambling variety of gold and silver stocks. This is where the action has been over the past several months. However, it may be time to start thinking of lightening up on those gambling stocks. Back in mid-2006 my Price Oscillator gave a clear warning of a turn around in this group, to the up side, by its positive divergence versus the Index action. NOW, the indicator is starting to give a negative divergence warning of a possible reversal of trend for this group, to the down side. Although not as emphatic as the signal last year the indicator HAS made a definite top and HAS turned downward.
This may be a situation such as in late 2005 when the Index moved lower for a few weeks and then gradually got back on track or it could be something more serious. WHAT IT IS is a warning that all may not be that great in this group and one should start being far more cautious and ensuring one has their exit strategies well rehearsed for their stocks. If there is a serious turn around you DO NOT want to be holding these gambling type of stocks, or any speculative ones, during such decline. The actual turn HAS NOT YET COME as the Index is still above its positive moving average lines, even the intermediate term average, and momentum, although weak, is still in its positive zone. But the warning is there for the potential ahead.
I highlight the Gamb-Gold Index because it has had a relatively positive momentum indicator for several months, and only recently started to weaken. The Qual and Spec-Gold Indices have had weak to negative direction momentum indicators for some time now. Their Indices show less aggressive trends than does the Gamb-Gold Index. Despite the warnings, as mentioned for the Gamb-Gold Index, the Spec-Gold Index is still above its moving average lines and its momentum indicators, although weak, are still in the positive zone so it is still BULLISH for the intermediate and long term. As for the Qual-Gold Index, It is below its Intermediate term moving average line with the line slope slightly negative. Its intermediate term momentum indicator, although positive, is continuing to move lower. For the intermediate term this Index may already be classified as BEARISH. The long term, however, is still BULLISH for the Qual-Gold Index.
SILVER
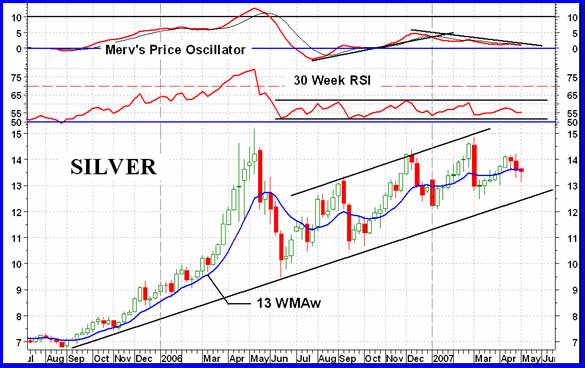
The weekly chart of silver shown here is for comparison with the other charts in the commentary. I have shown two different momentum indicators on the chart, one is my favorite RSI and the other is my own developed Merv's Price Oscillator. Every indicator tells you something, they all differ in one way or the other and most are in agreement most of the time. We have an RSI that has been showing a lateral (somewhat neutral) strength in the price action for a year now. It is once more at its lower band level. We have a Price Oscillator that showed strength in the price move initially but has now changed into a negative trend since late last year. This Price Oscillator is giving us a negative divergence indication. So, what should we expect ahead? Will the RSI strengthen taking the price into new highs? Will the Oscillator continue to move lower taking the price into a downward spiral? Stay tuned, only time will tell.
MERV'S QUAL-SILVER INDEX : MERV'S SPEC-SILVER INDEX
Although silver did not have a good week being one of the few negatives in the Indices table the two silver Indices themselves had good weeks with the Spec-Silver Index gaining a nifty 4.9% on the week (the Qual-Silver gained 2.1%). The Spec-Silver Index actually moved into new all time high territory with its weekly gain. That's the good news. As with the various gold Indices, these silver Indices are showing the same weak momentum indicators. Despite the new high the Spec-Silver Index still has a negative divergence in its Merv's Price Oscillator Index and the RSI is lateral to lower, although both are in their positive zones.
Here, as with the gold stocks, one should be on guard for a possible reversal of trend. The position of these two Indices is still BULLISH but with the momentum weakness/divergence it pays to be prepared.
MERV'S PRECIOUS METALS INDICES TABLE
Well. I'm calling it another week.
By Merv Burak, CMT
Hudson Aero/Systems Inc.
Technical Information Group
for Merv's Precious Metals Central
Web: www.themarkettraders.com
e-mail: merv@themarkettraders.com
During the day Merv practices his engineering profession as a Consulting Aerospace Engineer. Once the sun goes down and night descends upon the earth Merv dons his other hat as a Chartered Market Technician ( CMT ) and tries to decipher what's going on in the securities markets. As an underground surveyor in the gold mines of Canada 's Northwest Territories in his youth, Merv has a soft spot for the gold industry and has developed several Gold Indices reflecting different aspects of the industry. As a basically lazy individual Merv's driving focus is to KEEP IT SIMPLE .
To find out more about Merv's various Gold Indices and component stocks, please visit www.themarkettraders.com and click on Merv's Precious Metals Central . There you will find samples of the Indices and their component stocks plus other publications of interest to gold investors. While at the themarkettraders.com web site please take the time to check out the Energy Central site and the various Merv's Energy Tables for the most comprehensive survey of energy stocks on the internet. Before you invest, Always check your market timing with a Qualified Professional Market Technician
© 2005-2022 http://www.MarketOracle.co.uk - The Market Oracle is a FREE Daily Financial Markets Analysis & Forecasting online publication.