


Stock Market Volume Gives Shorts The Upper Hand
Stock-Markets / Stocks Bear Market Mar 18, 2009 - 08:23 AM GMTBy: Chris_Ciovacco


Rather than signaling the end of the bear market, the more probable outcome for the current rally in the S&P 500 is for it to fail somewhere between current levels and 806. Trading volume can help us understand market participants' collective desire to buy or sell a particular security or index. To formulate probable outcomes for the current rally in stocks, we will compare the S&P 500 long ETF (SPY) with the S&P 500 short ETF (SH). As we walk through this analysis, notice we are focusing on observable facts rather than forecasting what the future may hold. We assume we will get more of the same (lower lows in SPY/S&P 500 Index) until we see evidence to the contrary (higher highs, better volume, etc).
We briefly covered investing based on probable outcomes in Odds Continue To Favor Lower Lows In Stocks . We will restate the importance of cutting losses in any position when you are wrong. We are near trendline overhead resistance for stocks and we have a FED announcement on Wednesday – big moves up or down would not come as a surprise. Risk management remains very important to both the shorts and the longs.
There are numerous reasons to doubt the staying power of the current rally in the S&P 500. Based on the notations in the chart below (and other factors), there is little evidence to suggest the current rally is anything other than a bear market rally. The conclusion we draw from the data is the odds continue to favor lower lows in the U.S. stock market. At the same time, we acknowledge the lower probability outcome (a new bull market) is possible, but not probable. For long-term investors, holding cash still has better odds than owning the S&P 500 Index.
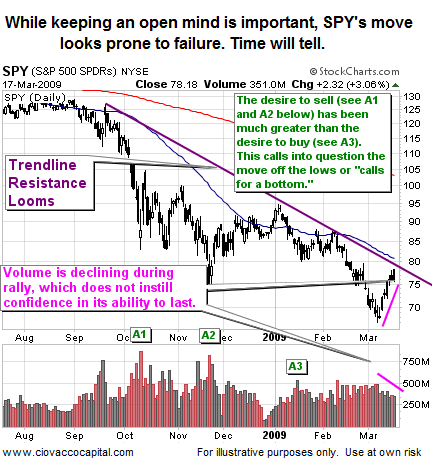
If we do see a break above the trendline in SPY (above), volume will help us determine its potential staying power. Stocks could move above the trendline for a few days and then reverse, especially if the break above trend occurs on relatively tame volume. A strong volume breakout holding for a few days would add to the bullish case. We just have to see how it plays out and make adjustment accordingly – no need to guess here.
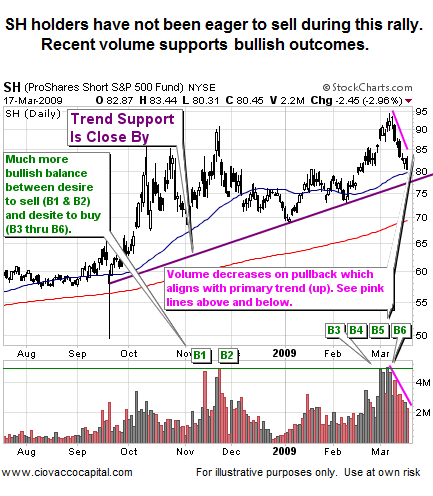
We can look to confirm our probabilities above by examining the S&P 500 inverse or short ETF (SH), which makes money when the S&P 500 falls, and loses money when the S&P 500 rises. Volume and trends continue to support favorable outcomes for SH. The lower probability outcome is for a permanent break of the upward sloping trendline (thick purple line).
Based on what we know as of Tuesday's market close, it is premature to call an end to the bear market. As conditions evolve and the charts change, we may draw a different conclusion. However, bullish conclusions may not come until after stocks head toward lower lows.
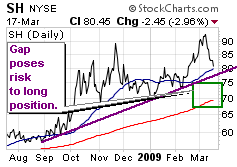 Fair and Balanced: If the lower probability outcome occurs, the small chart of SH shows the gap that could be filled between the purple trendline and 200-day moving average (thin red line). Stated another way, if the lower probability outcome occurs, SH could drop under $70, illustrating the need to (a) concede we could be wrong, (b) plan for it, and (c) have a specific risk management plan in place to protect capital if needed. Probabilities are just that – they are not certainties.
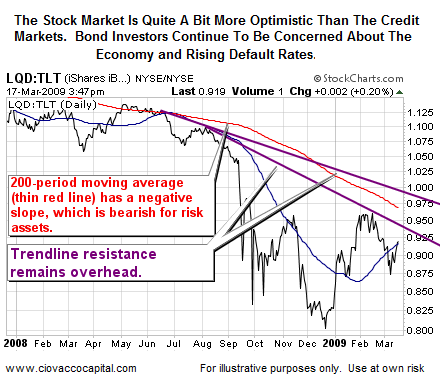
Now we will examine the current state of investors' willingness to accept risk. We will use bonds to do so, but the results affect all risk assets, including stocks. The chart below shows the ratio of investment-grade U.S. corporate bonds (LQD) to long-term U.S. Treasury bonds (TLT). The reason for looking at this ratio is quite simple. When investors feel more confident about future economic activity, they are more willing to take on the added risk associated with corporate bonds to earn a more favorable return (line trends up). Conversely, when investors feel less confident about the future and are more concerned about defaults, they will favor the safe haven and lower returns available in Treasuries (line trends down). The results are not encouraging for the sustainability of the current rally in stocks. With the primary downtrend below intact, we have more evidence to support a continuation of the primary downtrend in the S&P 500.
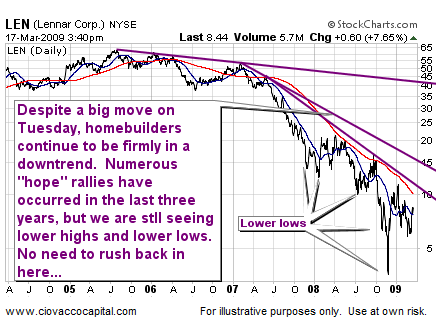
On Tuesday, we did get some good news on the housing front. Unfortunately, the chart of Lennar (LEN) looks less than bullish for long-term investors. Some nice gains will likely come in the homebuilders sometime in the future. However, it is still too early to buy in our book. We need to see more.
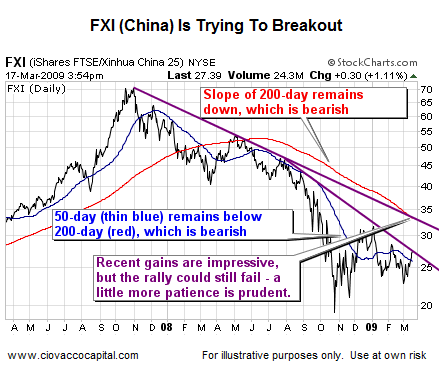
Numerous calls have been made for the end of the bear market in Chinese (FXI) stocks. Rather than buying, we would prefer to remain patient. A sustained break of trend here could be the first significant crack in the bear market dam. Bullish outcomes for FXI could pave the way for other risk assets to follow. Watching FXI with an open mind is a good use of our time.
When the charts above become more attractive on a long-term basis, we will be more than receptive to bullish interpretations. While every chart above may break the downward sloping trendlines in the coming weeks and months, we would prefer to see it happen rather than hoping it happens or forecasting that it will happen. When the trends become more favorable, there will be ample time to make money. For long-term investors, not short-term traders who have an understandably different approach, inverse positions remain more attractive than long positions in the vast majority of risk-related markets. If trendlines begin to break in the bulls favor, our interest in numerous asset classes would increase.
The charts and commentary above are for illustrative purposes only and are not recommendations to buy or sell any security.
Disclosure: The author and his clients have positions in SH
By Chris Ciovacco
Ciovacco Capital Management
Copyright (C) 2009 Ciovacco Capital Management, LLC All Rights Reserved.
Chris Ciovacco is the Chief Investment Officer for Ciovacco Capital Management, LLC. More on the web at www.ciovaccocapital.com
Ciovacco Capital Management, LLC is an independent money management firm based in Atlanta, Georgia. As a registered investment advisor, CCM helps individual investors, large & small; achieve improved investment results via independent research and globally diversified investment portfolios. Since we are a fee-based firm, our only objective is to help you protect and grow your assets. Our long-term, theme-oriented, buy-and-hold approach allows for portfolio rebalancing from time to time to adjust to new opportunities or changing market conditions. When looking at money managers in Atlanta, take a hard look at CCM.
All material presented herein is believed to be reliable but we cannot attest to its accuracy. Investment recommendations may change and readers are urged to check with their investment counselors and tax advisors before making any investment decisions. Opinions expressed in these reports may change without prior notice. This memorandum is based on information available to the public. No representation is made that it is accurate or complete. This memorandum is not an offer to buy or sell or a solicitation of an offer to buy or sell the securities mentioned. The investments discussed or recommended in this report may be unsuitable for investors depending on their specific investment objectives and financial position. Past performance is not necessarily a guide to future performance. The price or value of the investments to which this report relates, either directly or indirectly, may fall or rise against the interest of investors. All prices and yields contained in this report are subject to change without notice. This information is based on hypothetical assumptions and is intended for illustrative purposes only. THERE ARE NO WARRANTIES, EXPRESSED OR IMPLIED, AS TO ACCURACY, COMPLETENESS, OR RESULTS OBTAINED FROM ANY INFORMATION CONTAINED IN THIS ARTICLE. PAST PERFORMANCE DOES NOT GUARANTEE FUTURE RESULTS.
Chris Ciovacco Archive |
© 2005-2022 http://www.MarketOracle.co.uk - The Market Oracle is a FREE Daily Financial Markets Analysis & Forecasting online publication.