Most Popular
1. Banking Crisis is Stocks Bull Market Buying Opportunity - Nadeem_Walayat
2.The Crypto Signal for the Precious Metals Market - P_Radomski_CFA
3. One Possible Outcome to a New World Order - Raymond_Matison
4.Nvidia Blow Off Top - Flying High like the Phoenix too Close to the Sun - Nadeem_Walayat
5. Apple AAPL Stock Trend and Earnings Analysis - Nadeem_Walayat
6.AI, Stocks, and Gold Stocks – Connected After All - P_Radomski_CFA
7.Stock Market CHEAT SHEET - - Nadeem_Walayat
8.US Debt Ceiling Crisis Smoke and Mirrors Circus - Nadeem_Walayat
9.Silver Price May Explode - Avi_Gilburt
10.More US Banks Could Collapse -- A Lot More- EWI
Last 7 days
Stock Market Volatility (VIX) - 25th Mar 24
Stock Market Investor Sentiment - 25th Mar 24
The Federal Reserve Didn't Do Anything But It Had Plenty to Say - 25th Mar 24
Stock Market Breadth - 24th Mar 24
Stock Market Margin Debt Indicator - 24th Mar 24
It’s Easy to Scream Stocks Bubble! - 24th Mar 24
Stocks: What to Make of All This Insider Selling- 24th Mar 24
Money Supply Continues To Fall, Economy Worsens – Investors Don’t Care - 24th Mar 24
Get an Edge in the Crypto Market with Order Flow - 24th Mar 24
US Presidential Election Cycle and Recessions - 18th Mar 24
US Recession Already Happened in 2022! - 18th Mar 24
AI can now remember everything you say - 18th Mar 24
Bitcoin Crypto Mania 2024 - MicroStrategy MSTR Blow off Top! - 14th Mar 24
Bitcoin Gravy Train Trend Forecast 2024 - 11th Mar 24
Gold and the Long-Term Inflation Cycle - 11th Mar 24
Fed’s Next Intertest Rate Move might not align with popular consensus - 11th Mar 24
Two Reasons The Fed Manipulates Interest Rates - 11th Mar 24
US Dollar Trend 2024 - 9th Mar 2024
The Bond Trade and Interest Rates - 9th Mar 2024
Investors Don’t Believe the Gold Rally, Still Prefer General Stocks - 9th Mar 2024
Paper Gold Vs. Real Gold: It's Important to Know the Difference - 9th Mar 2024
Stocks: What This "Record Extreme" Indicator May Be Signaling - 9th Mar 2024
My 3 Favorite Trade Setups - Elliott Wave Course - 9th Mar 2024
Bitcoin Crypto Bubble Mania! - 4th Mar 2024
US Interest Rates - When WIll the Fed Pivot - 1st Mar 2024
S&P Stock Market Real Earnings Yield - 29th Feb 2024
US Unemployment is a Fake Statistic - 29th Feb 2024
U.S. financial market’s “Weimar phase” impact to your fiat and digital assets - 29th Feb 2024
What a Breakdown in Silver Mining Stocks! What an Opportunity! - 29th Feb 2024
Why AI will Soon become SA - Synthetic Intelligence - The Machine Learning Megatrend - 29th Feb 2024
Keep Calm and Carry on Buying Quantum AI Tech Stocks - 19th Feb 24

Market Oracle FREE Newsletter

How to Protect your Wealth by Investing in AI Tech Stocks

UK Housing Mortgage Meltdown for Purchases and Equity Withdrawals

Housing-Market / UK Housing Jun 24, 2008 - 07:37 AM GMT

By: Nadeem_Walayat

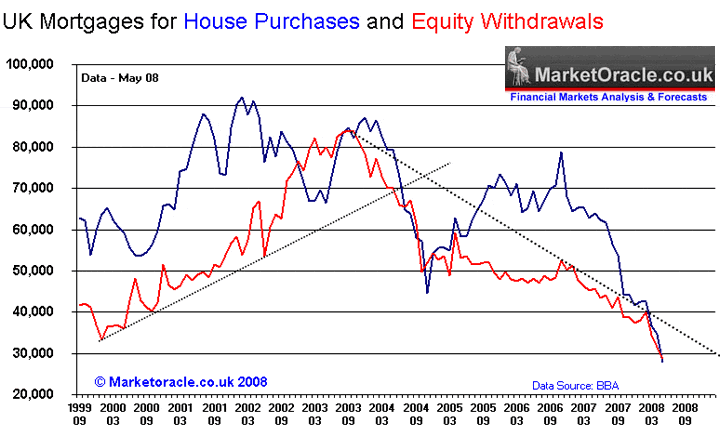
Housing-Market Best Financial Markets Analysis ArticleMortgages for home purchases and equity withdrawals continues to slump for May data released by the British Bankers Association, falling to just 27,968 approved loans down from 34,752 for April 08 and down by 56% from a year earlier. These are the worst lending figures since the BBA started recording mortgage data in 1997 and confirms that the UK housing market is trending towards a 1990's style housing market depression.

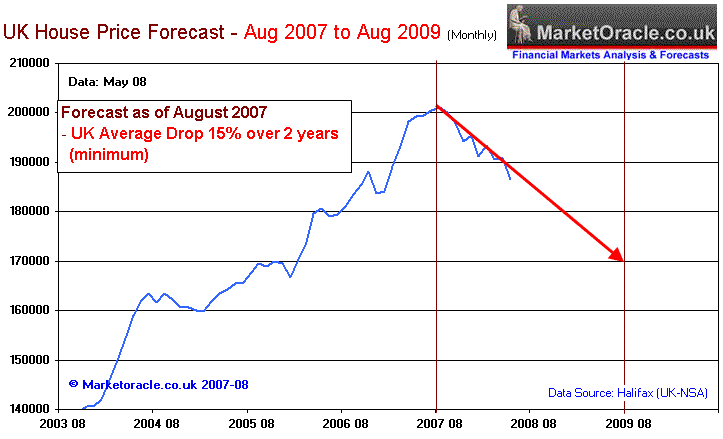
House price falls continued to accelerate and are on target for a crashette for the quarter April to June 2008. The expectation is that the housing market will move back towards trend for a 15% fall from August 2007 to August 2009. However this will mask falling housing market values in real terms as inflation continues to accelerate higher with the RPI expected to breach 5% and may even peak above 6% early next year.
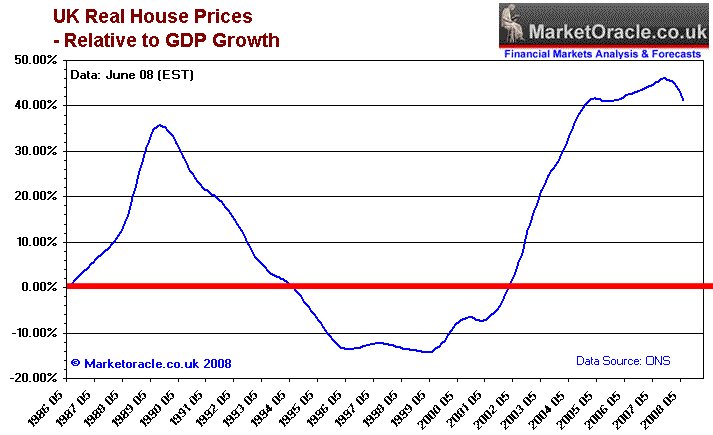
A series of recent analysis pointed to the strong possibility of the UK housing market to remain depressed for as long as the next ten years as the below graph illustrates that the UK housing market is very sentiment driven, and in many ways exhibits the same sort of behaviour as that of stock market investments moving between extremes of over valuation and undervaluation against the UK's GDP growth trend. The graph clearly implies a trend towards undervaluation which could take as long as 10 years to achieve as the housing market valuations are eroded by nominal house price fall, inflation and GDP growth.
UK Housing Market Analysis:

23 Jun 2008 - UK House Prices GDP Adjusted Real Trend Forecast
26 May 2008 - US and UK Housing Bear Market Trends
22 May 2008 - Council of Mortgage Lenders 2008 Housing Market Forecast Demolished
08 May 2008 - UK House Prices Tumbling- Interest Rate Conundrum
21 Apr 2008 - Bank of England Throws £50 billion of Tax Payers Money at the Banks
17 Apr 2008 - Credit Crisis SCOOP- LIBOR Is Now Irrelevant to Derivatives Pricing
08 Apr 2008 - UK House Prices Plunge Over the Cliff
01 Apr 2008 - How to Fix the Credit Markets
11 Mar 2008 - RICS Data Confirms UK Housing Market Heading for 1990's Style Crash
03 Mar 2008 - Credit Crisis Morphs Into Stagflation- Protect Your Wealth!
26 Feb 2008 - UK House Prices Fall for 5 Months in a Row- Housing Market Will Go Negative April 08
07 Feb 2008 - UK Interest Rates Cut to 5.25% - Will Not Help the Housing Market
21 Dec 2007 - UK Commercial Properties Crash Looms as Property Investment Fund Frozen
07 Dec 2007 - Analysis of Interbank and Base Interest Rate Spread
05 Dec 2007 - UK Home Owners Unable to Refinance Mortgages As Fixed Rates Expire During 2008
02 Dec 2007 - UK Housing Slump Gains Momentum as Properties Fail to Sell at Auction
10th Nov 2007 - Crash in UK House Prices Forecast for April 2008 As Buy to Let Investors Sell on Capital Gains Tax Change
28th Oct 07 - UK House Prices - Primary Reasons For a Sharp Fall
25th Sep 07 - UK Housing Market on Brink of Price Crash - Media Lessons from 1989!
22nd Aug 07 - UK Housing Market Crash of 2007 - 2008 and Steps to Protect Your Wealth
1st May 07 - UK Housing Market Heading for a Property Crash


By Nadeem Walayat

Copyright © 2005-08 Marketoracle.co.uk (Market Oracle Ltd). All rights reserved.

Nadeem Walayat has over 20 years experience of trading, analysing and forecasting the financial markets, including one of few who both anticipated and Beat the 1987 Crash. Nadeem is the Editor of The Market Oracle, a FREE Daily Financial Markets Analysis & Forecasting online publication. We present in-depth analysis from over 150 experienced analysts on a range of views of the probable direction of the financial markets. Thus enabling our readers to arrive at an informed opinion on future market direction. http://www.marketoracle.co.uk

Disclaimer: The above is a matter of opinion provided for general information purposes only and is not intended as investment advice. Information and analysis above are derived from sources and utilising methods believed to be reliable, but we cannot accept responsibility for any trading losses you may incur as a result of this analysis. Individuals should consult with their personal financial advisors before engaging in any trading activities.

Attention Editors and Publishers! - You have permission to republish THIS article. Republished articles must include attribution to the author and links back to the http://www.marketoracle.co.uk . Please send an email to republish@marketoracle.co.uk, to include a link to the published article.

Nadeem Walayat Archive

© 2005-2022 http://www.MarketOracle.co.uk - The Market Oracle is a FREE Daily Financial Markets Analysis & Forecasting online publication.


Comments

Linder
25 Jun 08, 05:37
Real and norminal HOuse Price FALL

Dear Nadeem

I have always enjoy reading your articles about House prices as they have some logical and real fact. But I am struggling to understand it when it comes to real/nominal value. For example, assuming the Average Peak Aug 2007 was £100k, and ifnlation for this year say 5% and 6% for the next year. With a 15% reduction in price, I would be grateful if you could tell me what they would be if one was to buy a property mid 2008 and mid 2009. Your help is much appreciated as this would help me to continue and understand your articles. Best Linder


Nadeem_Walayat
25 Jun 08, 10:19
Real/Nominal House Prices

Hi

I will publishing an article and trackg the real / nominal trends as both are important in determining the state of the housing market.

On a quick answer, 15% fall plus 6% +5% = 21% fall over 2 years on a real-terms basis.

A more accurate method is to calculate on a monthly basis.

Real terms falls are hidden i.e. not reflected in house price indices, but they DO impact on housing market sentiment as the mid to late 1990's witnessed that despite slowly rising prices, people were not eager to buy due to falling or stagnant real-term prices.


Post Comment

Only logged in users are allowed to post comments. Register/ Log in