


UK House Prices, Immigration and the London Property Bubble
News_Letter / UK Housing Apr 23, 2016 - 01:11 AM GMTBy: NewsLetter
 The Market Oracle Newsletter
Dec 11th, 2015 Issue # 25 Vol. 9
UK House Prices, Immigration and the London Property Bubble
Dear reader, London's housing bull market continues to gallop along at an astonishing pace which depending on which measure one looks at ranges from an annual rate of between 8% and 12%, and that the most recent surge higher has now lifted the average London house price to over an eye watering £600k! Pushing London house prices affordability ratio's upwards of X10 average London earnings, pushing London properties out of the reach of even the professional middle classes, let alone the army of working class necessary to keep the metropolis ticking over. Where many prospective home buyers are being forced to adopt extreme measures such as shared ownerships or be convinced by highly polished sales pitches that a tiny box studio flats priced at £300k+ in an run down (up and coming) area are a very good deal! So buy now before it is snapped up by someone else, probably who has yet to even set foot in Britain which highlights London's ultimate safe haven status, not just for the worlds people but capital of tax evading billionaires and people of more ordinary means plowing billions into London's better than gold property market each year. So it is no wonder that bubble crash talk has been rife, not just today but for many years, talk that I have to date dismissed as London has always been the epicentre for UK housing bull markets as per my long standing 5 year forecast for 2014-2018. Therefore this article seeks to evaluate the future prospects for London house prices and likely impact on UK average prices.
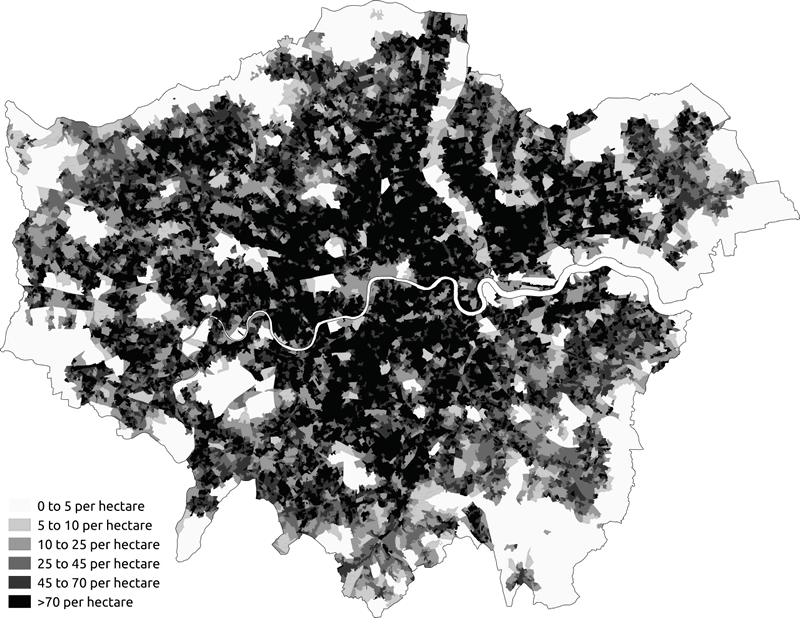
London Housing Market Demographics London's population has soared over the past 35 years from 6.6 million in 1981 to 8.7 million today, an increase of 2.1 million. However this masks a far greater change than the headline figure suggests as London has literally be transformed from a mostly white British city to a multi-layered multi-cultural city where the population density graph now masks the reality of London now being several cities over laid upon one another which whilst all being influenced by capital flows out of the central London global money markets, nevertheless will have their own house prices bull market driving epicentres.
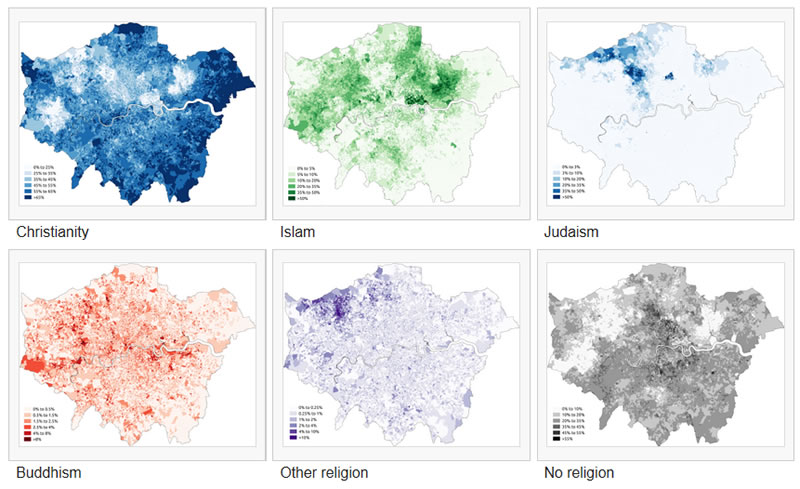
"Population Density London 2011 Census" by SkateTier - Own work. Licensed under CC BY-SA 4.0 via Commons. Some fifty years ago London may have been a city divided between affluent and deprived areas such as the East and West End, exhibiting great differences in house prices. However, vast migration flows of the past two decades has increasingly resulted in a multi-layered city, far more so than any other UK city which is as consequence of London being perceived as the world's ultimate safe haven and thus is the first port of call for most migrants that usually becomes their permanent home due to existing built up ethnic population densities as the following maps illustrate.
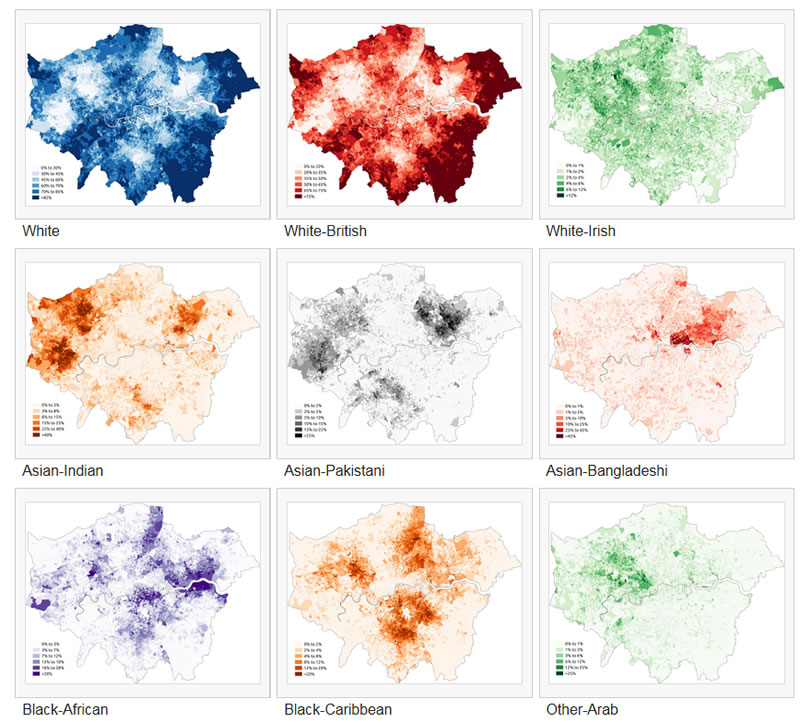
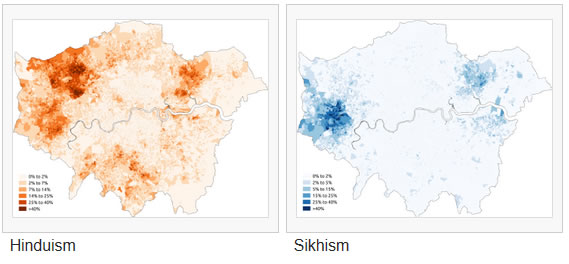
And breakdown by religion further results in population concentrations and house price demand epicentres.
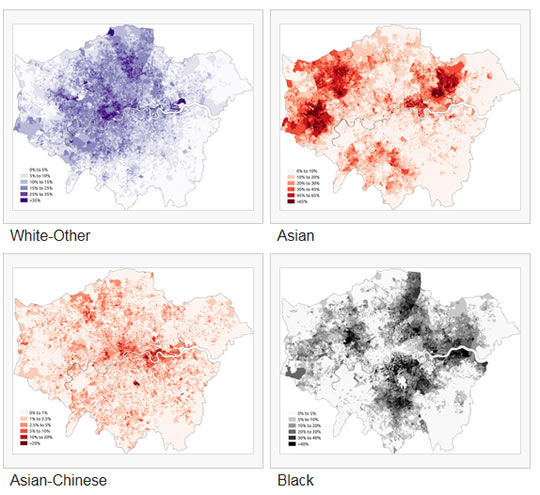
By SkateTier (Own work) [CC BY-SA 3.0 (http://creativecommons.org/licenses/by-sa/3.0)], via Wikimedia Commons Given the above maps it should not come as much surprise to know that today near 50% of London's population comprises ethnic minorities, most of whom (90%) are foreign born, that's right 45% of London's population is foreign born more so than any other major city on Earth. Which illustrates the magnitude of immigration that has been underway, and is one of the primary contributory factors for driving up London's house prices into the stratosphere, whilst at the same time displacing the white british population as whilst London has added 2.2 million people nevertheless the white british population has shrunk by over 1 million during the past 20 years which illustrates that London is fast trending towards comprising distinctly separate ethnic and religious enclaves including none British white enclaves originating from Eastern Europe. So what does this mean for London house prices? This means that London has multiple epicentres for driving London's housing bull market that are centered around high density of ethnic and religious population's that act to funnel capital into the London housing market as immigration drives further immigration of not just people but also capital from foreigners aware of existing large communities of their own ethnicity in London, the world's ultimate safe haven. For instance in recent years London has witnessed huge amounts of capital fleeing totalitarian states such as Russia, China and the Gulf states into London's property market into areas inhabited by people of their own ethnicity as a safe home for their capital and eventually themselves to permanently escape to. So it is not just the world's dubious billionaires / oligarchs who have been flooding London with their wealth for safety from corrupt regimes, but also many millions of individual people seeking to protect their wealth from their governments who see London property as a safe haven which thus contributes to to driving London house prices into the stratosphere as they are for instance convinced by slick sales pitches to buy tiny flats off plan in run down areas sold as 'up and coming' at ridiculous prices under the illusion that not only is their wealth safe in London but also will appreciate by x% per year. Thus London like a black hole is continuously sucking in people and capital from across the world, the rate of which tends to increase each year regardless of politician rhetoric, thus ever increasing demand from the ever increasing populations that are continuously displacing the white british population, revolving around cultural epicentres as London in reality is becoming many very distinct cities, so does not exhibit the pattern for house prices that tends to occur in virtually every other major UK city where there tends to be clear demarcation lines between affluent and deprived areas, instead London is a patch work of dozens of dispersed affluent areas that themselves revolve around the central London property market.
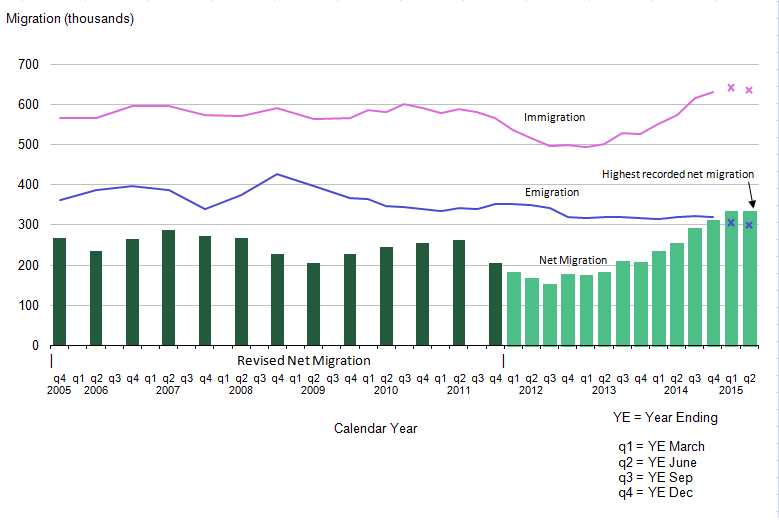
Out of Control Immigration London House Prices Driver Britains unrelenting immigration crisis just keeps getting worse with each ONS data release as the latest record busting net migration figure of 336,000 in the year to June 2015 illustrates, an increase in the rate migration of 32% on 2014. Which literally translates into a DAILY flood of near 1000 people turning up on Britain's shores and demanding housing, education and school places, jobs with benefits such as tax credits, health & social services that have been buckling, breaking and ultimately freezing as the social housing has in many cities already for several years in the wake of a 15+ year long trend of out of control immigration for which London has always been Britain's immigration epicentre as the earlier maps clearly illustrate. The Conservative governments failures to control immigration for the past 5 years is just a continuation of the Labour immigration catastrophe that set in motion a 15 year long immigration mega-trend for importation of over 8 million people (total immigration) where approx 90% of the adults were expected to vote Labour (90% on benefits such as tax credits). When David Cameron took power in 2010 he promised that he would cut net immigration by 2015 to the tens of thousands from the then disastrous annual figure of 205,000, instead the latest data from the ONS shows that net immigration has continued to SOAR each year to levels far higher level than 2010 to now stand at 336,000 for the year ending June 2015, a rise of 30% on the previous year. "Overall, net immigration would be kept in the tens of thousands, rather than the current rate of hundreds of thousands”. - David Cameron 2010 The bottom line is that the UK government has no control over Britain's borders which means that the immigration crisis is ACCELERATING and is EXPONENTIAL where the Conservative Government has failed to do anything to control what remains out of control immigration. And remember that the official statistics do not include illegal immigration totaling at least 1 million.
The immigration statistics break down into the following facts:
A key point that the mainstream press has apparently missed is that the net figures mask the reality of what the gross immigration figure of 636,000 implies, which effectively means that the impact of immigration is DOUBLE to that which the headline figure of 336k suggests i.e. in terms of social cohesion and housing and services for those pockets of the UK most effected by immigration namely London, the South East and other inner cities. Immigration is also one of the driving forces for the buy to let sector as foreign born populations are three times more likely to rent than UK born people, which in large part is due to the benefits system i.e. migrants greater propensity to claim housing benefit. Immigration Crisis Fast Becoming a Catastrophe Britain, Europe are not just dealing with the likes of the Syrian civil war that has produced over 4 million refugees, most of whom are determined to find their way to the likes of Germany and Britain, but also the fact Africa continues to undergo a population explosion, where the continents population looks set to DOUBLE once more over the next 30 years from 1.1 billion to 2.2 billion that will result in a migration exodus that will be exponentially greater than that which is taking place today, which implies an trend for ever increasing number of economic migrants from Africa alone, let alone the continuing increasing flows from a more preposterous Asia (China) and elsewhere who can afford to pay people smugglers for transportation to a new life in the UK as I have covered in depth in the following video analysis -
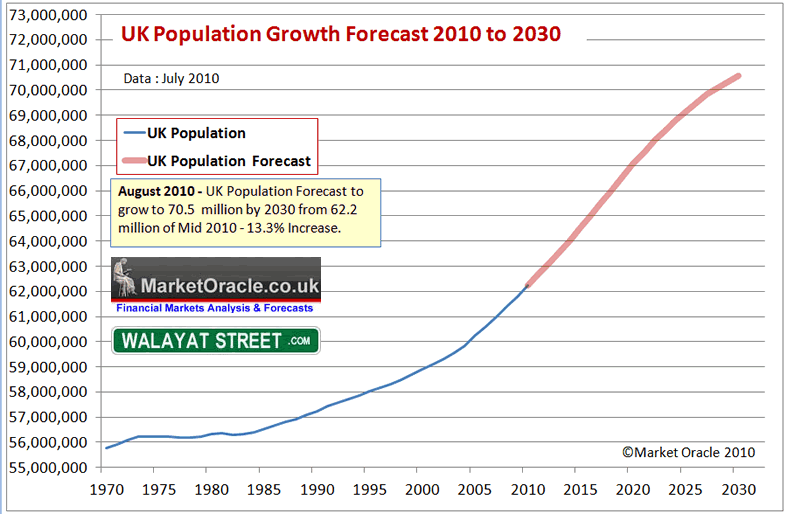
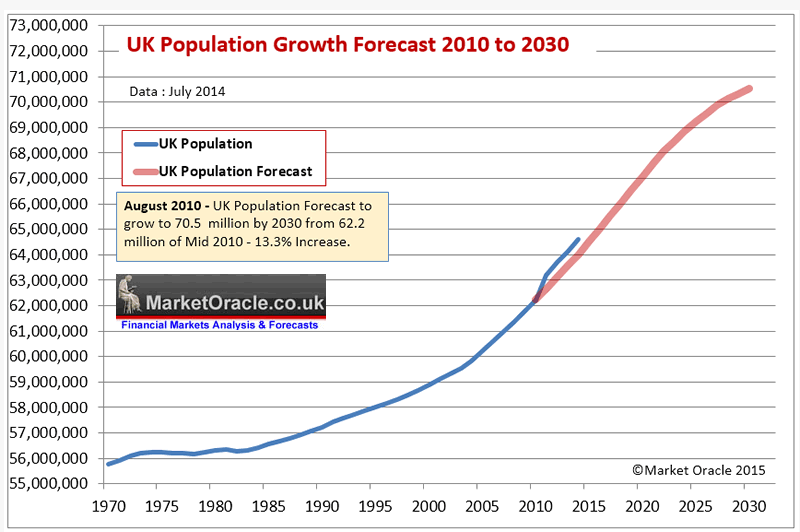
Therefore, whilst today the mainstream broadcast press crisis coverage of immigration is focused on the camps of tens of thousands of migrants on Europe's southern borders and even some 5,000 near the port of Calais. However, Britain should prepare itself for what the trend implies looks inevitable that within the next few years already buckling and highly stressed state services will break under the weight of numbers in response to which the government will be forced to introduce unprecedented measures such as cordoning off pockets of Southern England into self contained migrant camps of first in the tens of thousands and ultimately numbering in the hundreds of thousands in an attempt to contain the consequences of the immigration catastrophe that is the implied as a consequence of 10 million immigrants entering the UK (net 5 million) over the next 10 years that will be in addition to natural population growth of at approx 4 million. In fact 10 years from now the UK will likely have whole villages and even towns cordoned off as permanent migrant camps in an attempt to contain the catastrophe. And looking into the not too distant future, London's increasingly rigid ethnic and religious enclaves are sowing the seeds for the probable breakdown of social cohesion as increasingly people will virtually live their whole lives without venturing out of their ethnic and religious enclaves, apart from the occasional sight seeing day trips to central London. This will throw up a whole host of potential consequences over the coming decades due to the risks of a myriad of ancient conflicts being imported and then played out on London's streets such as the civil war between Sunni and Shia Islam. What happens when large enclaves start to demand self determination, even declaring themselves Independent so as to detach themselves from what they see as alien and subversive cultures. Can't happen? Think again, all it would take is population concentrations to start to exceed 75% density for such crisis to start to become manifest. London is not there yet but that is the direction in which it is fast trending when population density reaches critical levels of 85%-90% that start to trigger calls for self determination, own systems of education and law and ultimately some form of separation from the British state that would undoubtedly be highly disruptive for the future prospects for house price inflation. UK Population Growth Forecast My long standing forecast is for the UK population to grow from 62.2 million as of Mid 2010 to at least 70.5 million by 2030 as illustrated below: UK Population Growth and Immigration Trend Forecast 2010 to 2030) The assumptions being factored into the UK population growth forecast are for a natural UK population growth rate of births exceeding deaths of 0.33% per year (current 200k), coupled with net average current immigration trend of 240k per year, supplemented with climate change refugees averaging 50k per year from 2015 onwards extrapolates into the following trend forecast over the next 10 years that targets a rise from 62.2 million as of mid 2010 to 67 million by mid 2020, and should the same trend be maintained beyond 2020 then the UK population could rise to above 72 million by mid 2030. However in all probability the country will not experience the post 2020 trend due to several converging factors including political pressures, capacity constraints and the UK's relegation in the economic prosperity leagues. Which implies a tapering off of net immigration in favour of natural growth which implies a lower total of nearer 70.5 million by 2030 as illustrated by the below graph.
The updated UK population graph shows an actual trend trajectory as per the most recent ONS population data into Mid 2014 of 64.6 million, which suggests that the UK population could increase by an additional 4 million by 2030 approx 2 million of whom will settle in London as a consequence of what amounts to continuing out of control immigration and high birth rate.
This has huge implications for Britain in terms of housing, services, wages, education, welfare and social cohesion that will make the crisis of the past decade look like a picnic. For in depth analysis see 15 Apr 2015 - UK House Prices, Immigration, Population Growth and Election Forecast 2015, and the following video -
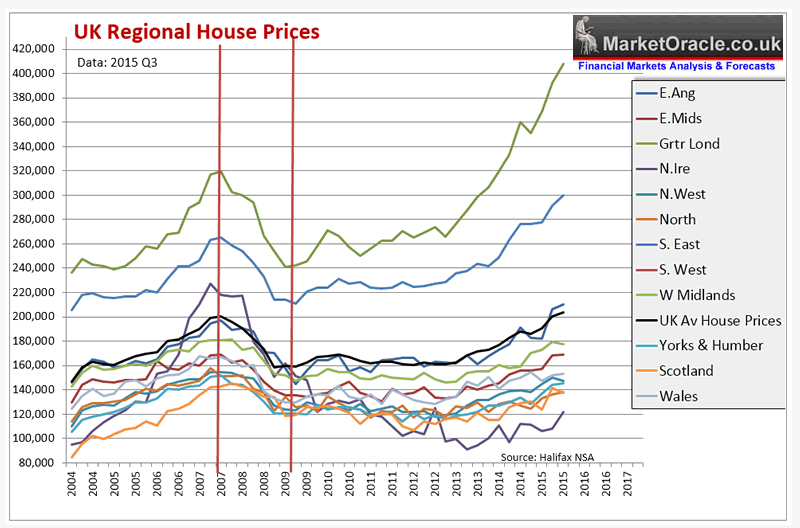
The bottom line is that it is pointless for the likes of George Osborne announcement to build 400,000 affordable homes over the next 5 years, because it does not matter how many new homes built, 400k, 500k, even 1 million will make no difference to Britain's housing crisis for the simple fact that Britain has an immigration crisis as continuing out of control immigration ensures new demand will always far outstrip new supply. With the epicentre for the immigration crisis being made manifest in London which whilst has been good for house price so far, nevertheless as my earlier analysis highlighted is in fact trending towards future crisis due to there being no plan or objective to assimilate migrant populations, instead the exact opposite is occurring in the formation of high population density enclaves that sow the seeds for self determination Kosovo style. London House Prices Compared to the Regions Average UK house prices have now risen by 30% from the 2009 bear market low to currently stand at an average price of £204,119 (Halifax NSA Oct 2015), and are currently galloping along at an annual inflation rate of 10%. However, the UK average price masks huge regional variations in trend and momentum most notable of which is that London has literally soared into the stratosphere, up over 70% from it's bear market low and by virtue of which has pulled the average UK house price indices higher as illustrated by the below graph.
The most obvious pattern being observed is that the nearer a region is to London then the greater the house price inflation experienced. Therefore London is acting as the bull market's epicentre that is rippling out waves of capital which are mostly absorbed by the surrounding South East region then the next nearest regions, all the way to Britain's most furthest region, Scotland which was not helped by Scotland's attempted suicide that was the 2014 Independence Referendum which held Scotland's housing market back until after the election outcome. Whilst Northern Ireland, the smallest UK region has observed the greatest volatility given its heavy reliance on central government spending so as to help prevent the locals from once again sparking civil conflict. Northern Ireland saw prices reach a bubble mania peak of £227,000 in 2007, which was followed by an equally spectacular collapse to just £90k as recently as mid 2013, the last to bottom, with the subsequent trend to £121k attempting to play catchup with the rest of the UK. Apart from the South East, the rest of the UK's regions tend to lag behind the UK average, nevertheless some of the current deviations are at extremes when compared against the averages of the past 20 years, thus offering investor possibilities as well as warnings for some:
For further in-depth analysis of regional house prices see my recent video analysis:
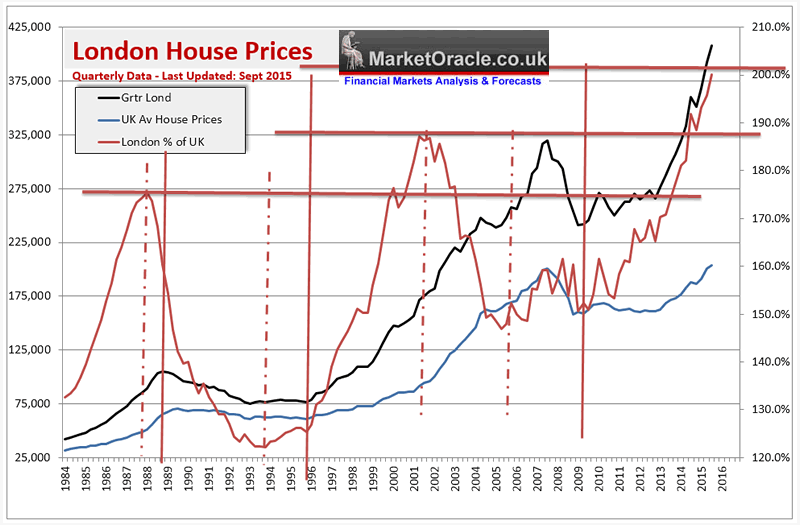
London Property Bubble? To get an angle on whether London is in a property bubble or not I again refer to a comparison between London and the rest of the UK in the following graph that shows the percentage deviation in average London house prices from the UK average of the past 30 years
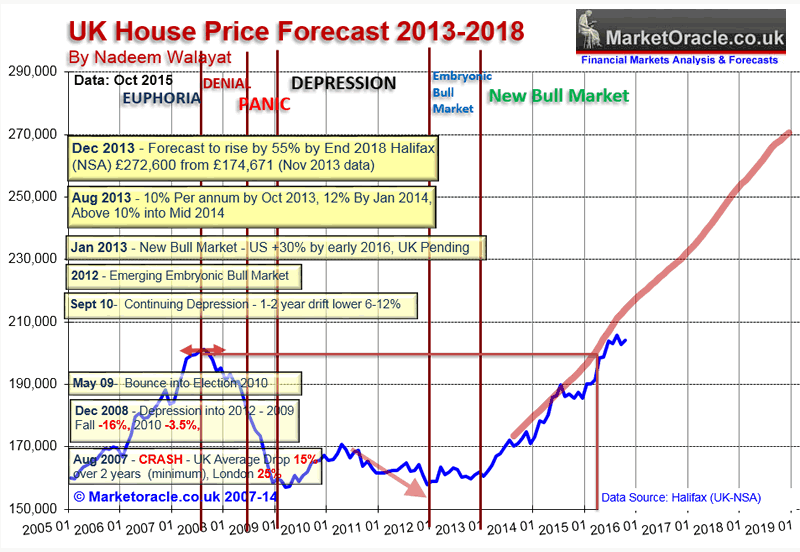
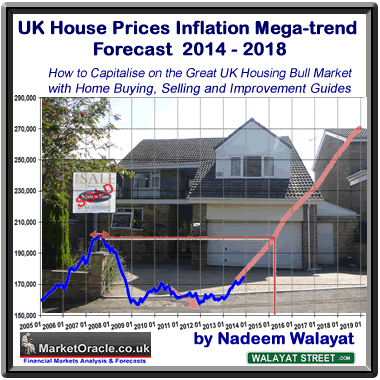
Current deviation from the UK average of 202% is at a new 30 year extreme. Previous deviation extremes junctured at +180% and +190%, therefore 202% is at a probable juncture for London House prices. However, a deviation juncture does not mean that London house prices area about to fall as during the last bull market London house prices continued to rise for another 5 years AFTER the deviation Juncture as the rest of the UK played catchup to London. Therefore London is extremely overbought, but this does not mean that falling London average house prices, yet a crash is imminent. Rather that it appears that London is imminently about to pass the housing bull market baton to the rest of the UK. Therefore this suggests that London is going to experience a significant slow down in average house price inflation and even falls for some locations, whilst the rest of the UK will see an acceleration in house price inflation, which is supportive of my long standing house prices forecast expectations for the bull market to continue for another 3 years - UK House Prices Forecast 2014 to 2018 - Conclusion This forecast is based on the non seasonally adjusted Halifax House prices index that I have been tracking for over 25 years. The current house prices index for November 2013 is 174,671, with the starting point for the house prices forecast being my interim forecast as of July 2013 and its existing trend forecast into Mid 2014 of 187,000. Therefore this house prices forecast seeks to extend the existing forecast from Mid 2014 into the end of 2018 i.e. for 5 full years forward. My concluding UK house prices forecast is for the Halifax NSA house prices index to target a trend to an average price of £270,600 by the end of 2018 which represents a 55% price rise on the most recent Halifax house prices data £174,671, that will make the the great bear market of 2008-2009 appear as a mere blip on the charts as the following forecast trend trajectory chart illustrates: (updated)
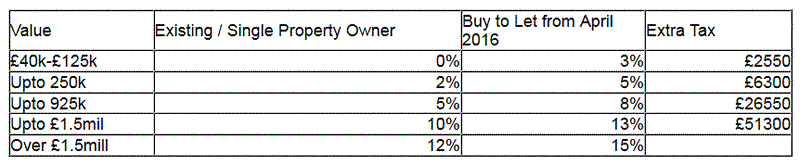
Stamp Duty Tax And briefly a reminder that changes in stamp duty tax will be a significant hit to London's housing market over the coming years and even more so for the buy to let brigade who will now pay an additional 3% surcharge when buying properties.
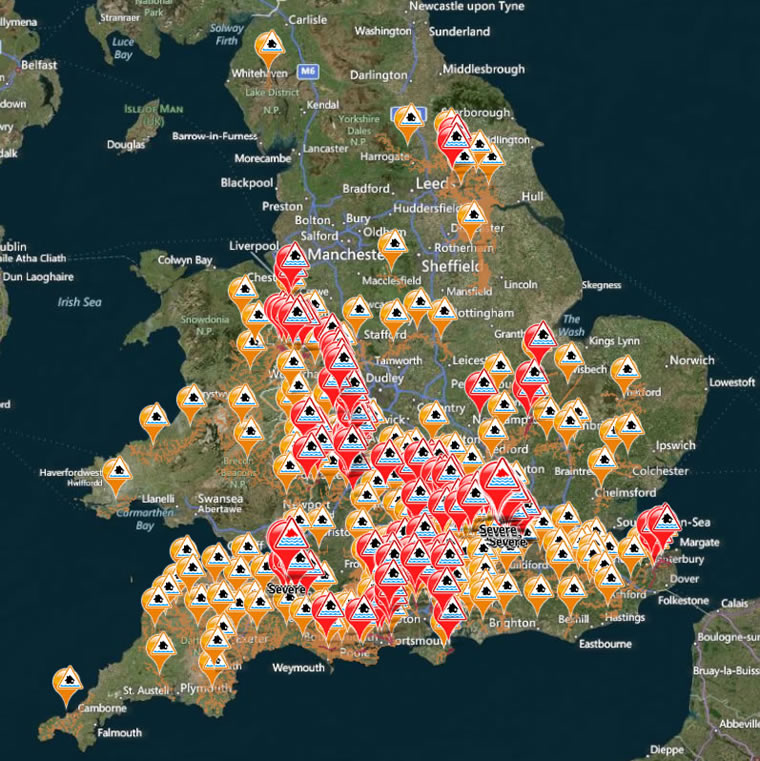
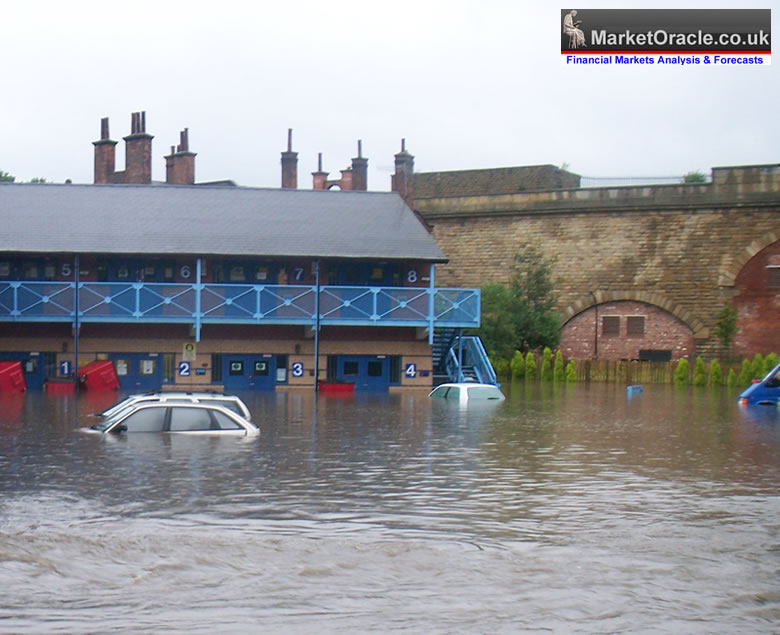
Though ironically this should result in a temporary surge in house prices over the next few months, especially at the lower end of the market which will be set against those buy to let landlords who have had enough and decide to sell their portfolios into temporary strength before the next negative measure is announced. London and Climate Change Future Flooding Risks What were supposed to be once in century floods are now occurring every 5 years or so as the North of England has been witnessing this December, as the consequences of climate change are starting to make real extreme weather effects become manifest with costly consequences for home owners and not just in terms of costly repair bills and replacement of flood damaged items but the negative hit on house prices right across the UK as the escalating future consequences of climate change will increasingly be factored into home buying decisions. The once in a century floods of less than 2 years ago across the South of England as a series of Jet stream driven storms dumped huge amounts of water over most of Southern England every 2 to 3 days, far beyond the capacity of the river systems to cope with that were continuously overflowing onto already saturated land resulting in ever escalating flood alert warnings as illustrated by the below map.
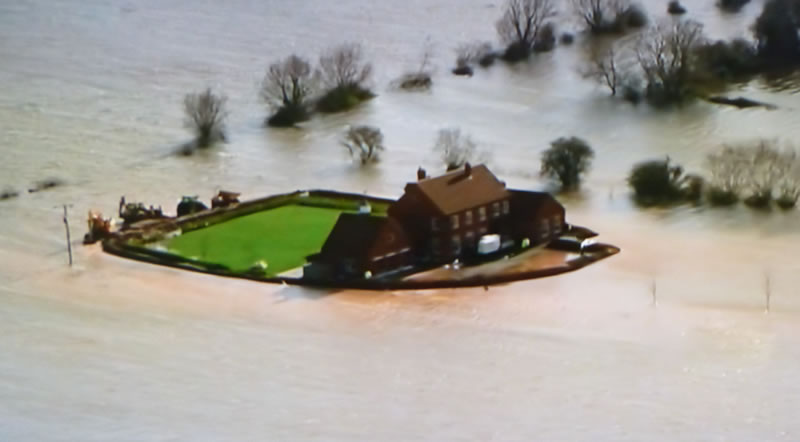
The floods illustrated that whilst London can continue building ever greater flood barriers to defend itself from rising sea levels, what it can't guard against is the increasing frequency of ever greater amounts of Thames river busting rainfall that will increasingly occur at least once a decade. Many scientists use the term Global Weirding to describe what is taking place with our climate as melting of the sea ice at the north and south poles effects atmospheric air current circulations such as the diversion of the Jet Stream resulting in the ongoing series of extreme weather events, where this year and early 2014 it was heavy rainfall and for the year before it was extreme cold and snowfall. Whilst prospective home buyers can change many aspects of their properties after purchase, however one thing they cannot change is the geography of the location so it is of utmost importance that home buyers seek to mitigate the risk of flooding as a consequence of climate change by following a few simple rules in their property selection process so as to prevent making a disastrous decision resulting in buying a property that they may be unable to re-sell at a later date.
The problem of homes being flooded can only worsen not only as a consequence of climate change but also due to the madness of over 10,000 homes continuing to be built on flood plains each year with desperate buyers enticed to purchase at discounts of 10% to 20% against similar properties on higher ground, with an estimated 18% of homes now being at risk of flooding, up from 17% a year ago. House Prices Crash Whilst homes flooded this month are going to be hit hard in terms of plunging home valuations. However, these only form the tip of the flood risk house prices crash ice-berg as it begins to slowly dawn on prospective home buyers that once in a century floods could become annual events. Therefore this ultimately spells doom for the house price valuations of as many as 20% of Britain's homes. Home Buying and Future Flood Risks The key points to consider in terms of the evaluating the risk of flooding is not just whether the property is near the coast and thus subject to sea level rise but also how far is the property in terms of its distance in height from the valley floor / river basin. This can be worked out by comparing the difference in elevation by subtracting the properties ground floor height above sea level against the height above sea level of the nearest valley / river basin i.e. a property 50 metres above sea level against the nearest river that is 30 metres above sea level would put the property at +20metres above the river basin. In my opinion, home buyers should as a minimum not buy properties of less than 30 metres above sea level AND 10 metres in elevation from the valley floor / height of the normal river, even though this would remove many properties out of potential target locations and will extend to far beyond the environment agency's own current flood maps that tend to only cover 2 to 4 metres above the normal height of nearby rivers as recognised flood plains. However, the reason for the extra minimum height is to not only guard against the uncertain future as a consequence if climate change induced sea level rise and heavy rain fall flooding, but also to allow for failure of the drainage system which means that properties tend to flood to several metres above the height of overflowing rivers. Therefore following the minimum 10metre rule (higher the better) will not only prevent flooding but act to protect house price valuations against an across the board mark down of all properties within a few meters elevation of the flood risk zone.
More reasons to only consider properties well out of range of a flood plain / river basins is that even if a property has never flooded, just by being near a flood risk area is enough to increase insurance premiums or worse make properties uninsurable that would put off many prospective home buyers and thus result in deep under valuation at time of selling of anywhere between 15% to 40% as compared to similar properties situated on as little as 10 metres higher ground. So again as a general rule prospective home buyers should not contemplate buying properties that are less than 10 metres above the height of any nearby river, water way or valley floor which puts virtually all riverside and flood plain properties out of contention so as to mitigate both the risks of actual flooding and negative effects on house prices which means that many Thames river bank properties, especially up stream are literally living on borrowed time and thus owners of such properties would be well advised to sell before the next flood hits. Furthermore as the global warming climate change mega-trend continues to play out properties that are far beyond the flood plains and valley floors are increasingly look set to secure an ever increasing price premium over lower lying properties of even on the same street. The starting point in understanding the flood risks of one's target location is to visit the Environment Agency's website and enter the post code for the area, this will give an over view of the local flood map. Then use this as a guide to compare against elevation maps of the target area, finally fine tuning down to individual properties and aiming to ensure that they are well beyond the minimum 10 metre height from the normal river levels.
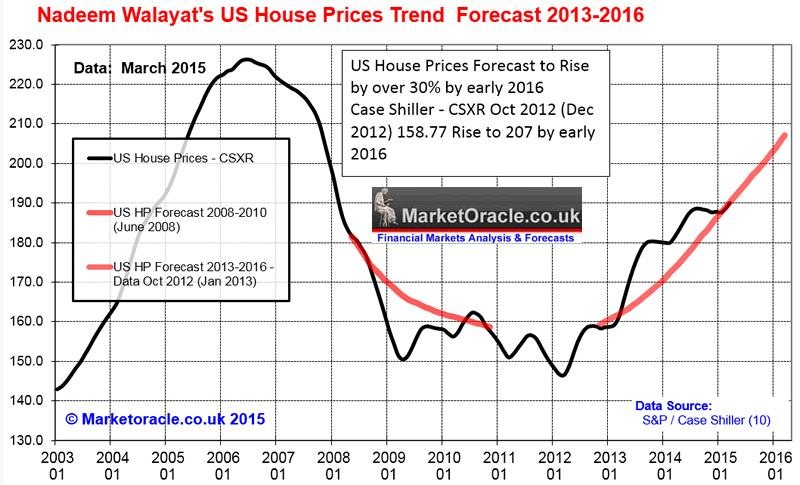
For those already stuck with properties within few metres height of rivers or situated on flood plains then the only solution apart from attempting to move when the dust settles is to have effective plans in place to cope with inevitable flooding such as having temporary barriers and a pump on standby, and ensuring drains are fitted with non return valves. For those who remain determined to buy properties despite being near rivers or on a flood plain then they need to ensure that the property has been built with flood defences in mind i.e. built on stilts that put the property at least 1.5 metres above the highest preceding recorded flood. Unfortunately rather than being the norm most new build properties on flood plains do not tend to incorporate such structural defences such as having the residency area built over a ground floor garage which effectively adds 3 metres to the ground floor height to the properties. London House Prices Conclusion Pulling all of the threads together paints a rather bleak picture for the future prospects for London house price inflation, as it looks like we are witnessing the peak of the London property bubble mania, at least in terms of deviation from the UK average. But this does not mean that there will be across the board price falls let a lone a crash. Rather that London will increasingly under perform the other UK regions over the coming years as it steadily loses its 100% premium to the UK average that could easily be whittled down to +50% over the next few years. In terms of house price inflation, expect 2016, 2017 and 2018 to average UNDER 5%, which compares against this year's 10%. In fact London over the next 3 years will probably turn out to be Britain's worst performing region. However, the sub 5% average masks what will happen across the London's property epicentres. What will probably happen is that the most expensive, most affluent properties will take the hardest hit, and probably see significant price falls, whilst the lower end of the market in terms of location rather than property type will do much better and so exceed the 5% average. And looking further ahead, we may also be witnessing a LONG-TERM Juncture for London, which whilst it will continue to retain a premium over the rest of the UK, nevertheless this bull market may mark the end of future bull market extremes of reaching anywhere near today's 100% premium to the UK average. So in my opinion London is no longer the best place for long-term UK property investing, which means a lot of property investors who have plowed headlong into the London mania over the past few years are going to get badly burned, especially those who have bought flats which are likely to be by far the worst performing property type that are likely to suffer heavy price falls, which is why I have repeatedly warned to avoid buying flats for several years. My next in-depth analysis (FREE Newsletter) will seek to conclude in a detailed trend forecast for U.S. house prices for several more years beyond my existing forecast from October 2012 to early 2016 - 12 Jan 2013 - U.S. Housing Real Estate Market House Prices Trend Forecast 2013 to 2016) US House Prices Forecast Conclusion - As you read this, the embryonic nominal bull market of 2012 is morphing into a real terms bull market of 2013, with each subsequent year expected to result in an accelerating multi-year trend that will likely see average prices rise by over 30% by early 2016, which translates into a precise house prices forecast based on the most recent Case-Shiller House Price Index (CSXR) of 158.8 (Oct 2012 - released 26th Dec 2012) targeting a rise to 207 by early 2016 (+30.4%).
Stock Market Santa Rally 2015? And finally see my most recent video for the prospects for the Stock Market in the face of much doom and gloom, including today's over 300 point Dow plunge, all in the lead up to this months expected Fed interest rate hike.
Ensure you are subscribed to my always free newsletter for ongoing in-depth analysis and concluding detailed trend forecasts that include the following planned newsletters -
Source and Comments: http://www.marketoracle.co.uk/Article53301.html By Nadeem Walayat Copyright © 2005-2015 Marketoracle.co.uk (Market Oracle Ltd). All rights reserved. Nadeem Walayat has over 25 years experience of trading derivatives, portfolio management and analysing the financial markets, including one of few who both anticipated and Beat the 1987 Crash. Nadeem's forward looking analysis focuses on UK inflation, economy, interest rates and housing market. He is the author of five ebook's in the The Inflation Mega-Trend and Stocks Stealth Bull Market series that can be downloaded for Free.
Disclaimer: The above is a matter of opinion provided for general information purposes only and is not intended as investment advice. Information and analysis above are derived from sources and utilising methods believed to be reliable, but we cannot accept responsibility for any trading losses you may incur as a result of this analysis. Individuals should consult with their personal financial advisors before engaging in any trading activities.
You're receiving this Email because you've registered with our website. How to Subscribe Click here to register and get our FREE Newsletter To access the Newsletter archive this link Forward a Message to Someone [FORWARD] To update your preferences [PREFERENCES] How to Unsubscribe - [UNSUBSCRIBE]
The Market Oracle is a FREE Financial Markets Forecasting & Analysis Newsletter and online publication. |
||||||||||||||||||||||||||||||||||||||||||||||||||||||||||||||||||||||||||||||||||||||||


© 2005-2022 http://www.MarketOracle.co.uk - The Market Oracle is a FREE Daily Financial Markets Analysis & Forecasting online publication.