


UK House Prices Bear Market Trend Forecast 2009 Update
Housing-Market / UK Housing May 07, 2009 - 12:13 AM GMTBy: Nadeem_Walayat

 With the stealth stocks bull market bouncing along nicely towards the mid May interim target of Dow 8,750, attention is increasingly being drawn towards green shoots of economic recovery elsewhere, specifically in the UK housing market which has endured a severe bear market that began following the August 2007 peak. Therefore this in depth analysis seeks to provide an up to date answer to the question as to whether the UK housing market is near a bottom or not, following the release of UK house price data for April which showed an headline drop of 1.7% for April though the non seasonally adjusted figure showed a pause with average UK house prices now standing at £157,156 down 22% on the August 2007 Peak.
UK Housing Bear Market Recap
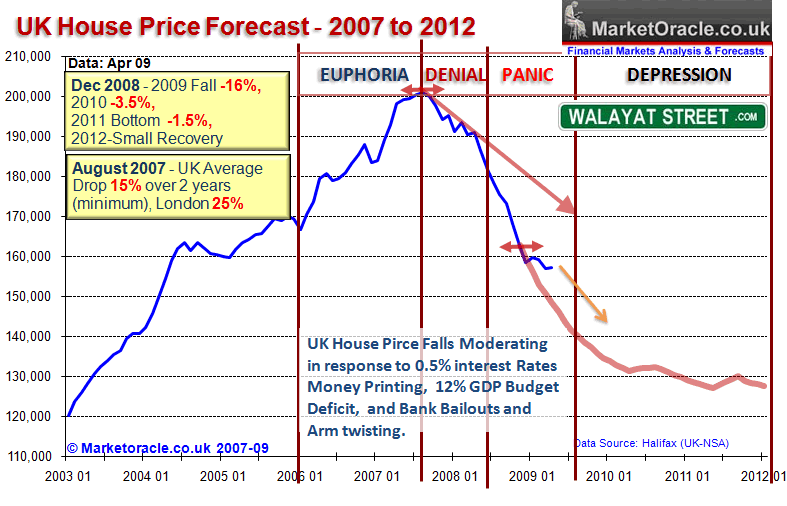
UK house prices peaked in August 2007 (UK Housing Market Crash of 2007 - 2008 and Steps to Protect Your Wealth), and thereafter followed an accelerating bear market trend into December 2008 which took UK house prices lower by more than 20% and prompted the in depth updated house price forecast that covered the trend into 2012, which projects for a total drop from peak to trough of 38%. The rate of descent peaked for December 08 data at -19% and has now improved to -17.7% for April 09 data. The housing market crash is showing signs of pausing which as the government has in its power the ability to print money to effectively bring nominal house price falls to standstill, this money printing is now quaintly termed as "Quantitative Easing" so as to hide the truth and mask the continuing crash in UK house prices that despite the opinion of the mainstream press by the likes of Anatole Kaletsky and Ambrose Evans-Pritchard HAS put Britain on the path towards bankruptcy, as explained in the depth analysis of November 2008 - Bankrupt Britain Trending Towards Hyper-Inflation?, and more recently - Darling's Recession Debt Crisis Budget, Britain's £1.2 Trillion Public Sector Black Hole
UK 1st Quarter Economy Collapses by GDP 1.9%
UK GDP contraction for the 1st quarter of 2009 took the mainstream media by storm by recording a larger than expected quarterly drop of -1.9%, which was set against consensus forecasts for a 1.5% contraction. Barely 2 days earlier the Chancellor Alistair Darling had forecast GDP contraction of 3.5% for 2009, 1.25% growth for 2010 and 3.5% growth for 2011. At the time I stated that Alistair Darling forecasts implied a miraculous turnaround and was set against my own forecast as of February 09 for 2009 GDP contraction of 4.75%, with peak to trough contraction of -6.3%.
The volume of output in the production industries is estimated to have decreased by 5.5 per cent this quarter. Manufacturing output decreased by 6.2 per cent. Mining and quarrying decreased by 3.4 per cent and Electricity, gas and water supply decreased by 1.9 per cent. Output of the service industries is estimated to have decreased by 1.2 per cent.
First quarter GDP data busted Alistair Darlings forecasts within a matter of days of publication, as increasingly my forecast of -4.75% contraction for 2009 is becoming more probable. Many mainstream forecasting organisations are playing catchup by revising GDP lower for 2009 for instance the IMF now forecasts GDP contraction of -4.1% for 2009. The -1.9% drop was exactly in line with my trend expectations that took GDP down to -0.94% on that of 12 months earlier.
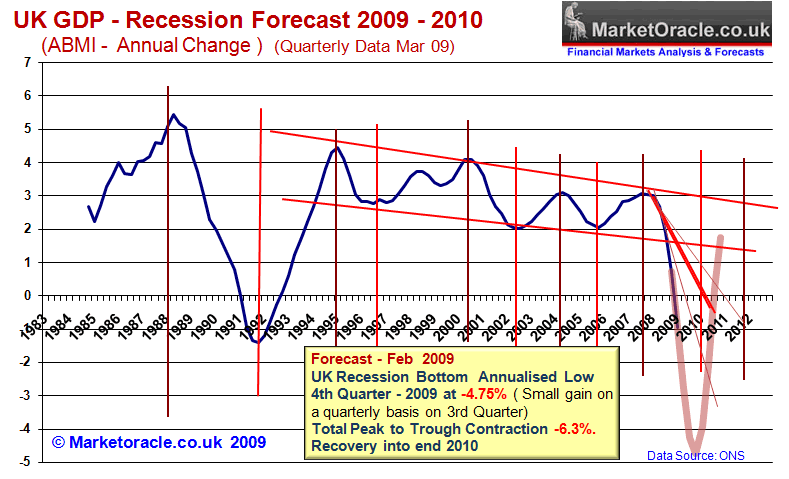
Total GDP contraction to date now stands at -4% on a quarter to quarter basis, which is against my forecast for -6.3%, which strongly suggests that GDP contraction during the 2nd and 3rd quarters for 2009 'should' moderate i.e. we are unlikely to see another figure as bad as 1st Q -1.9%, more probably the 2nd quarter GDP is likely to range between -1% to -1.2%. Though there is the risk of an even deeper recession, for comparison the 1990-92 recession saw GDP contract by 2.5%; the early 1980's by 4.6% and the Great Depression witnessed contraction of approx 8% (though Britain had experienced a series of economic depressions following the end of World War 1 so the 8% figure does not paint a true picture). Therefore today's recession still does look set to be the worst since the Great Depression of the 1930's.
Whilst a bounce back in the economy is expected going into 2010, however the tax hikes and spending cuts will in all likelihood trigger a double dip recession during 2011 to 2012, instead of the mini-boom growth of 3.5% forecast by the Labour government. What this means is that there will be a major shortfall in tax revenues and therefore a continuing budget deficits and hence deeper public spending cuts and therefore continuing pressure on the housing market into at least 2012 as clearly unemployment rising to 3 million and falling incomes is going to continue to bare down on house prices despite the falls to date.
Alistair Darling's irresponsible budget resulted in a a net give away of £5 billion, against borrowing of £175 billion for 2009 as against the Chancellors own forecast of barely 6 months ago of borrowing of £38 billion. Instead of positioning the countries finances to cope with the huge public sector budget deficit the government has instead focused itself on the next general election which is still a year away.
The governments optimistic budget forecasts have been well and truly busted as the below graph illustrates the difference between expected budget deficits against Wednesdays revisions, set against my own budget deficit forecast.
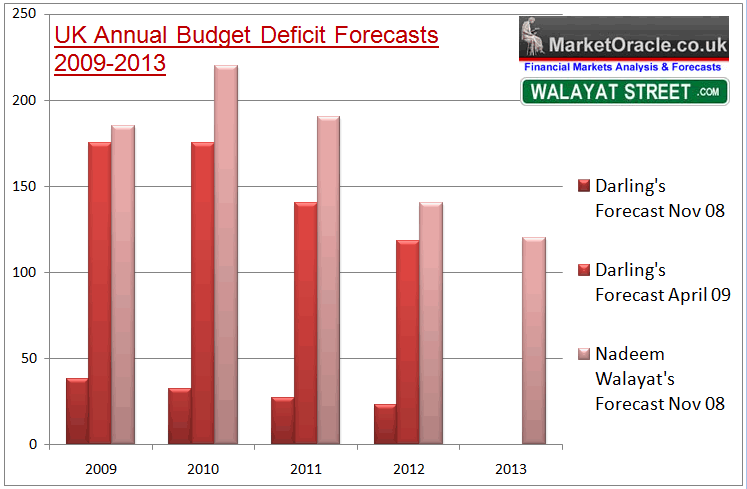
Alistair Darlings forecast for government net borrowing over the next 4 years in November 2008 totaled just £120 billion which was in total denial of the collapse of the UK economy that had fallen off of the edge of a cliff during the summer of 2008 and accelerated during the September / October financial crisis. The magnitude of the level of the budgetary crisis is now some six months later being publicly acknowledged by revised forecasts for the budget deficit that the Chancellor now sees totaling £608 billion instead of the £120 billion forecast of November 08. This is still significantly below my forecast total of £735 billion and therefore the expectation remains for further revisions to the upside over the coming years.
The effect of all of this deficit spending will be supportive of house prices going into the 2010 election and shortly thereafter, however this does not necessarily mean house prices will rise, but rather the pace of decline will moderate and thereafter remain depressed for a protracted period of time, with government actions post the 2010 election expected to put increasing pressure on the housing market beyond 2012 as the government attempts to bring the budget deficit under control, so little chance of a housing boom returning any time during the next 4 years.
Britain on the Path to Bankruptcy
The level of debt continues exploding higher, both that which is on the visible balance sheet as well as off the balance sheet tax payer liabilities that now project a rise from £1.75 trillion at the end of 2007 to £3.9 trillion by the end of 2010. As pointed out several times over the past 12 months following the Bank of England's initial £50 billion hand out to the soon to be Bankrupt banks in April 2008 that loan would in all likelihood never be repaid and mark the start of a series of hundred billion pound loans that would put Britain on the path towards a debt crisis that in the first instance would manifest itself in a sterling bear market whilst the Bank of England remained paralysed by the fear of inflation and failed to respond to the housing market crash of 2007-2009 until forced to do so in October 2008.
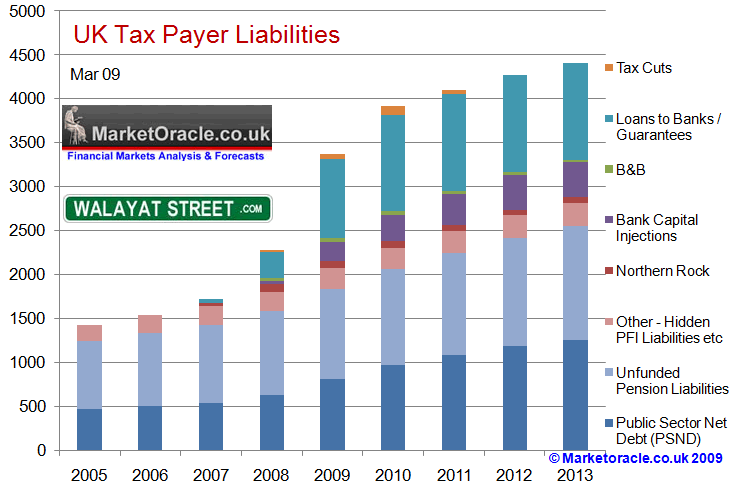
As the government issues more debt, i.e. gilts then the market will demand ever higher interest charges which means ever higher debt servicing costs. Taking the official debt, i.e. Public Sector Net Debt of £624 billion at the end of 2008 at a rate of 4% costs Britain £25 billion per year to service. However public sector net debt is expected to mushroom to 1359 billion by the end of 2012, which at 4% would demand a servicing cost of £54 billion a year. If however interest rates are significantly higher which is highly probable than the service costs at 7% would cost Britain £95 billion a year, these interest payments can only mean much higher taxes, and therefore a weak housing market.
The in depth UK recession forecast update is due for completion following release of GDP data later today, to receive this in your in box make sure to subscribe to my always FREE Newsletter.
RICS Paints a Positive Picture
The Royal Institute of Chartered Surveyors (RICS) is reporting that the average sales per surveyor increased for the first time since late 2007 as the number of sales ticked up to 9.7 from a low of 9.6 last month as record low interest rates of 0.5% have cut the mortgage servicing costs for homeowners coupled with the government running an unsustainable £160 billion per annum budget deficit as the government announces ever more reckless stimulus packages and thereby attempting to entice prospective home buyers back into the housing market, though an up tick from 9.6 to 9.7 in the number of sales amounts to a pretty insignificant move of just 1%.
RICS comments :
"The tentative signs of a pick-up in activity have become more broadly based over the past month,"
"The higher level of buyer interest is feeding through into actual sales. Newly agreed sales, measured on a net balance basis, rose over the month as did the average sales per surveyor series, for the first time since the tail end of 2007."
However actual house prices according to RICS continue to fall with 73% reporting price falls against 78% for February with a house price balance of -77%, so not exactly what one could term as a housing market bottom but rather a moderation in the pace of decline.
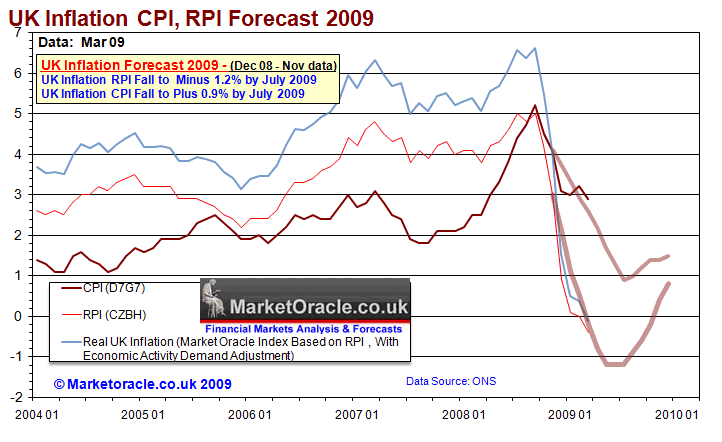
UK Inflation
The trend in inflation data is inline with my original forecast as of Dec 08 that saw deflation going into mid 2009, followed by a rising inflationary trend during the second half of 2009 and therefore supportive of the view that interest rates will start to rise by the end of 2009.
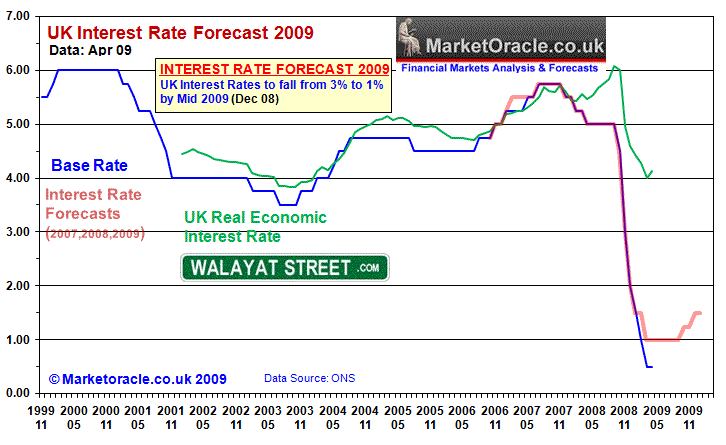
UK Interest Rates Have Hit Bottom
UK interest rates standing at 0.5% are AT THE BOTTOM as a further cut to 0.25% would make NO DIFFERENCE to economy, but instead hit sterling. Therefore the only question now is WHEN will UK interest rates start to rise again, my original forecast as of 4th of Dec 08 is for rates to start rising during the second half of 2009 as the economy begins to stabilise from free fall following the governments borrowing and deficit spending binge. This will slowly wean home owners off of the ultra low interest rates. However the base rate of 0.5% has not resulted in a significant impact on the economy as the economic interest rate remains stubbornly above 4% with expectations that the large amount of government bonds to be issued this year will force the governments hand into either printing hundreds of billions more pounds to buy government bonds or to raise long-term interest rates, either way the interest rate outlook for homeowners during he second half is not as accommodative as during the first half of 2009.
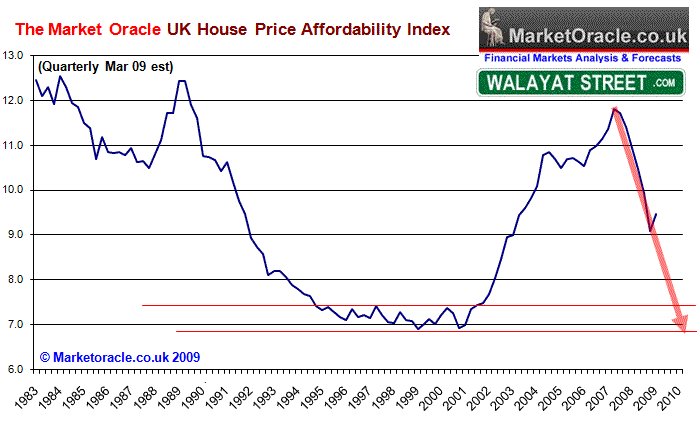
UK Housing Market Affordability
The UK house price crash to date which has seen £45,000 wiped off the value of houses in 20 months coupled with the unprecedented Interest rate cuts have boosted affordability significantly, however this was offset during the first quarter by the collapse in economic activity that actually resulted in an up tick in the affordability index which illustrates the extreme stress that home owners remain under as unemployment rises and hence wages contract as more and more homeowners experience a severe drop in earnings. Given the fact that interest rates have hit their floor i.e. with the base rate at 0.5% there is not much lower they can go especially as inflationary forces will again start to re-appear later this year. This is supportive of the view that house price falls will sooner rather than later resume their downtrend and therefore continue to show a trend towards the affordability target level.
UK Mortgage Market
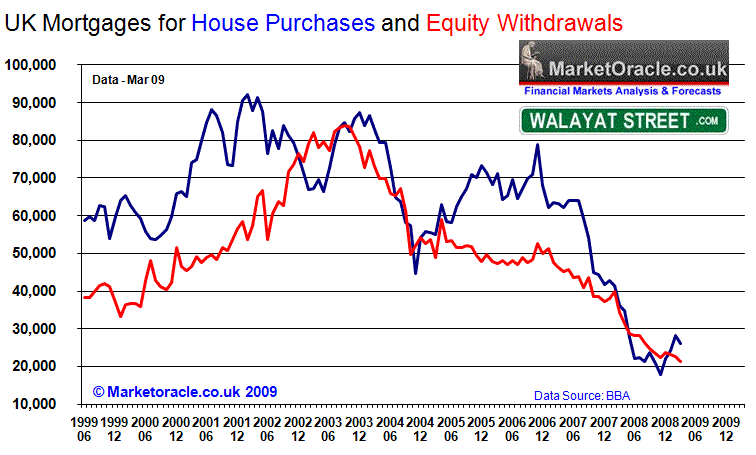
The arm twisting by the Government that first began as long ago as April 2008, following the meeting with bankers and a £50 billion cash hand out at the time, has finally started to impact on the mortgage market as the banks are finally starting to lend more for home purchases. The floor in lending and positive trend therefore supports the view that the pace of house price declines will moderate, as banks will gradually increase the amount loaned out, after all they have been now defacto nationalised with the liabilities more or less covered by the tax payers and hence little actual risk carried to the actual banks as bad loans can following the governments insurance scheme be dumped onto the tax payers. Of note however to the wider economy is the continuing downtrend in equity withdrawal loans which implies that the consumption will continue to fall and therefore there is so far no recession bottom seen in these figures.
Another negative for prospective home buyers is the fact that now risk averse lenders are increasingly seeking large deposits in the order of 40% or more for their better mortgage deals, which in effect negates the impact of increased lending as the tendency is still to drive over priced houses lower towards a level where buyers are able to meet the higher deposit requirements.
Repossessions and Negative Equity
Whilst the number of repossessions is forecast to hit a high of 75,000 this year, matching the the early 1990's peak of 75,000, however this masks the impact of all of the government initiatives and bank arm twisting measures in an attempt to artificially keep people in their homes by a variety of means such as the "Mortgage Rescue Scheme" in the run up to the 2010 general election. This therefore means that reported repossessions data such as that from the Council of Mortgage Lenders (CML) will tend to under-report the true state of the impact of repossessions on the UK housing market as the reported repossession figures will mark but the tip of a much larger ice berg that could run to as much as a million home owners in arrears and helped to stay in their properties in one shape or another that will continue to impact negatively on the housing market price trend due to the supply of negative equity over hanging the market, awaiting a bounce back to sell into.
UK House Price Trends in Real Terms
Whilst most housing market commentators focus on the headline indices such as that produced by the Halifax and Nationwide, however looking at the currency and inflation adjusted measures can act as leading indicator for housing market trend.
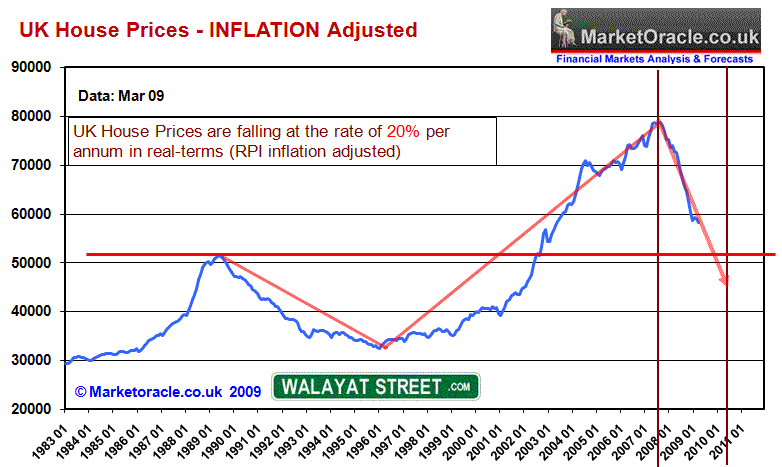
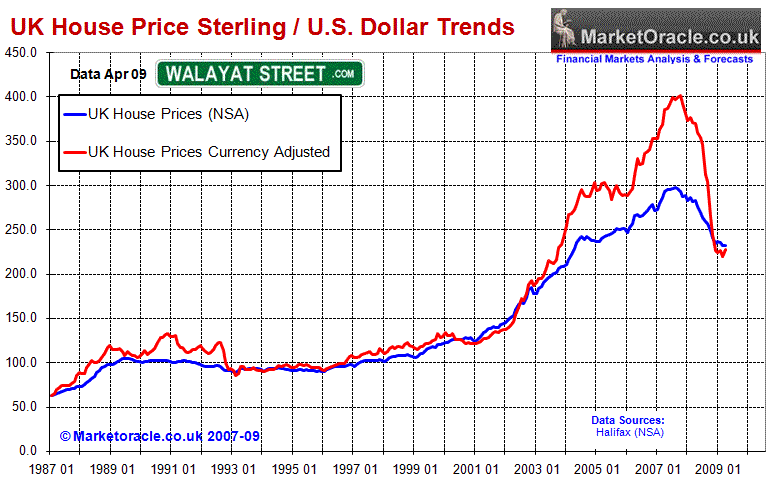
The above graphs clearly illustrate that the UK housing market has crashed by more than 25% (real terms) and over 40% (U.S. Dollar / Euro) to a rate well beyond trend which is having a severe impact on the UK economy as the real deflation of a 40% loss of value of house prices added to the more than 50% of that of stocks has tipped the UK economy towards economic depression. Therefore home buyers need to guard against the ILLUSION of stabilising house prices in nominal terms in the short-term which is as a consequence of excessive price falls well beyond the trend and therefore house prices are returning back back towards trend.
UK GDP House Prices Trend
Whilst many methods have been utilised in determining future housing market trend such as on the basis of average earnings, mortgage interest rates, currency valuation, inflation adjusted, comparison against other housing markets and real disposable earnings, this item brings to the table housing market analysis against UK GDP growth. The assumption here is that the value of assets after stripping out inflation should increase in inline with the countries actual growth rate as measured by gross domestic product.
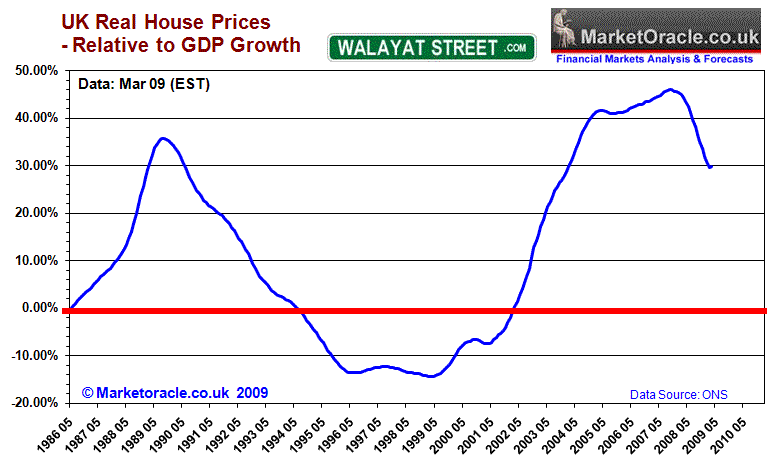
The above graph illustrates that the UK housing market is very sentiment driven, and in many ways exhibits the same sort of behaviour as that of stock market by moving between extremes of over valuation and under valuation against the UK 's GDP growth trend.
Despite UK house prices having fallen by 22%, the trend from an extreme reading of more than 45% above the GDP valuation has barely begun its decline, this is as a consequence of contracting GDP and real deflation, both factors will are putting a continuing severe strain on the UK housing market as an economy in recession is unlikely to halt the pace of house price declines let alone suggest a housing market bottom any time soon. At worst this is suggesting a further 50% fall in house prices. However the government in its recent actions of quantitative easing aka money printing, has decided to ignite inflation which will possibly return towards the end of 2009 with a vengeance, therefore this more probably suggests a further fall in nominal house prices of 25%, i.e. implying a total fall from the peak of approaching 40%. Similarly should the economy start to recover starting 2010 as the economic forecast alludes to, then this will contribute towards the equalisation of house price values without anywhere near as severe a fall as the above graph suggests at this moment in time due to temporary deflation.
UK Money Supply - Deflation
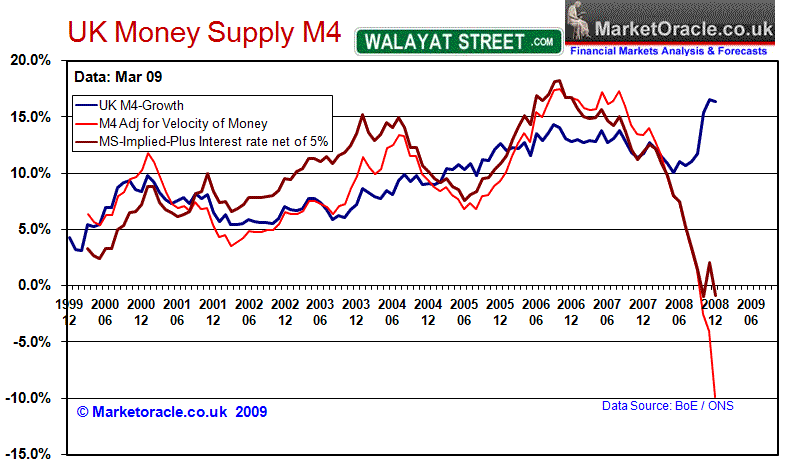
Whilst UK Money supply M4 (blue) has risen sharply from the 10% targeted low of mid 2008 to the current level of 16.4%, on face value this is highly inflationary and has been taken by many economists and market commentators to continue suggest much higher forward inflation. However the money supply adjusted for the velocity of money which takes into account the state of the economy as a consequence of the credit freeze tells a completely different story. The UK economy is now in extreme real monetary deflation of approaching -10%. The leading indicator of the implied money supply, is suggesting recent deep interest rate cuts to just 0.5% will lift future money supply growth out of extreme deflation, however it will still be far from supporting the levels north of 15% which accurately forecast forward inflation during 2008, but now suggest deflation for much if not all of 2009.
This implies that the housing bear market trend will continue in the deflationary environment with little sign in the money supply data of a significant inflationary spark this side of 2010.
Japan's House Price Depression
Many of the reasons put forward during the UK housing boom as to why house prices would not fall in the UK as elaborated earlier could equally apply to the Island of Japan. However, whilst we in the UK enjoyed a booming housing market the Japanese endured a severe bear market as the below graph illustrates.
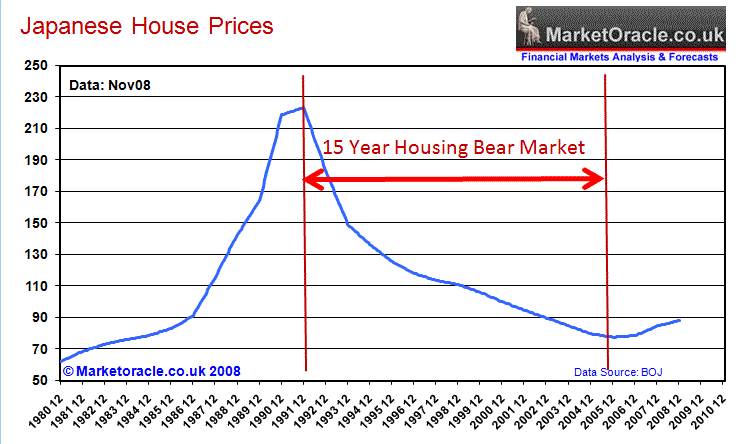
Japan's house prices peaked in 1991 and 18 years later still stand an average 60% below their peak. Whilst I am not saying that Britain's house prices could replicate Japans housing crisis some 18 years from now, however the Japanese experience does illustrate that house prices are NOT a one way bet, even on a long-term basis where house prices could enter a prolonged downturn for a decade especially given the current extreme deflationary environment.
Conclusion
Those looking for an near term bottom in the UK housing market are going to be greatly disappointed with little to suggest that the overall trend of house prices is going to stabilise at these lower levels let alone start to rise. All home owners can expect is a few months of stability following which the bear market is set to continue albeit at a more measured rate as the market remains firmly in the grip of the panic stage as originally elaborated upon in the analysis of December 2008.
The UK housing bear market trend is expected to moderate for 2009 from the forecast -16% towards -10%, however the downtrend is expected to continue for many more years at a shallower pace as the housing market depression will have the effect of slowly sapping the will of home owners who continue to mistakenly hold on to hope of a return of the housing boom to sell into that will FAIL to materialise as the house prices eventually drift towards the forecast for a peak to trough contraction of approx 38%. Please feel free to add your comments to this analysis here.
For 120 Pages of Forecasts and Analysis on ALL Major World Markets? For Free! Download Now, hurry this offer ends on the 8th of May.
Newsletter Schedule of in depth Analysis -
- UK Recession Forecast Update 1 - Last - Feb 2009 - Peak to trough contraction -6.3%, 2009 contraction -4.75%.
- Gold Forecast 2009 - Update 1 - Last - Jan 2009 - Rally to Early March $960, Fall to $820 Mid 2009.
- Stocks Stealth Bull Market - Significant Summer Correction? - Last April 09 - Interim Analysis - Dow rally to 8750 by mid May followed by summer correction.
Subscribe to my always FREE Newsletter to receive this analysis in you in box.
By Nadeem Walayat
http://www.marketoracle.co.uk
Copyright © 2005-09 Marketoracle.co.uk (Market Oracle Ltd). All rights reserved.
Nadeem Walayat has over 20 years experience of trading derivatives, portfolio management and analysing the financial markets, including one of few who both anticipated and Beat the 1987 Crash. Nadeem's forward looking analysis specialises on the housing market and interest rates. Nadeem is the Editor of The Market Oracle, a FREE Daily Financial Markets Analysis & Forecasting online publication. We present in-depth analysis from over 250 experienced analysts on a range of views of the probable direction of the financial markets. Thus enabling our readers to arrive at an informed opinion on future market direction. http://www.marketoracle.co.uk
Disclaimer: The above is a matter of opinion provided for general information purposes only and is not intended as investment advice. Information and analysis above are derived from sources and utilising methods believed to be reliable, but we cannot accept responsibility for any trading losses you may incur as a result of this analysis. Individuals should consult with their personal financial advisors before engaging in any trading activities.
Nadeem Walayat Archive |
© 2005-2022 http://www.MarketOracle.co.uk - The Market Oracle is a FREE Daily Financial Markets Analysis & Forecasting online publication.