


Current Stock Market Rally Within Supercycle Stocks Bear Market
Stock-Markets / Stocks Bear Market May 12, 2009 - 07:42 PM GMTBy: Bob_Bronson

 Confirming our long-standing forecasts:
• Notwithstanding normal fluctuations in economic data, the U.S.-led global recession continues to accelerate to the downside.
• GDP, corporate earnings, house prices, and auto sales are still dropping sharply.
• Efforts to replace the U.S. dollar as the world’s reserve currency have begun.
• Bob Bronson wins a 10-year bet on calling the Supercycle Stock Bear Market
The current stock-market rally is the fourth significant rally in the past six months. As you can see in the chart below, the current rally has not had any more power (a steeper slope) or duration than previous rallies, each of which failed to be sustainable and each of which ended in steep decline. In fact, it was at the end of an even longer, eight-week rally (red circle at top left of chart) on October 9, 2007 that the current downtrend began, reaching a low of -58% thus far. The best-fit channel of the highs and lows of all four rallies is consistent with our expectation of a resumption of the decline to lower lows in the coming weeks.
Our work strongly suggests that the second downleg of the 18-month-old Supercycle Bear Market1 is not over, contrary to bullish investors’ hope that the recent advance indicates a bottom was reached on March 6. We have demonstrated that the path of a Supercycle Bear Market is like a ball bouncing downstairs, with typically bigger bounces off progressively lower steps. In fact, the largest one-day, one-week, one-month, and one-quarter advances in stockmarket history have all occurred during ongoing Supercycle Bear Markets. Investors must be careful not to misjudge these normal retracements as indications the decline is over, regardlessthe size of the bounce.
Based on the factors in our forecasting models, some of which we discuss below, we believe the stock market is poised to decline substantially lower than the recent March 6 low. In our opinion, investors who buy or continue to hold stocks during the remainder of this second downleg of the Supercycle Bear Market will suffer substantial downside volatility from current levels.
A 12-Year Retrospective
By the time of our Year-End 2008 commentary, there was no longer any question that the U.S. was – and for months had been – in a recession. The official recession-dating organization, the National Bureau of Economic Research (NBER), had finally announced that the recession started in December 2007 according to their criteria,2 although an earlier date is certainly supported by analysis of broader data, as we also discuss below.
The calamitous economic and financial impact of the massive housing-market bust, homeowners defaulting on mortgages, trillions of dollars of mortgage-backed securities collapsing, venerable financial institutions careening towards insolvency, the global financial system grinding to a halt, businesses shuttering, unemployment rising, consumer confidence battered, and consumer spending plummeting has precipitated the most massive U.S. government intervention since the Great Depression in a desperate attempt to mitigate the damage.
1 A Supercycle Bear Market is the most severe combination of the several bear markets typical during a Supercycle Bear Market Period, running typically from the highest to lowest point in the Period. For example, during the previous Supercycle Bear Market Period from 1965-82, the Supercycle Bear Market lasted for the six years from the high point in December 1968 to the low point in December 1974.
2 According to the NBER’s website, “a recession is a significant decline in economic activity spread across the economy, lasting more than a few months, normally visible in real GDP, real income, employment, industrial production, and wholesale-retail sales.”
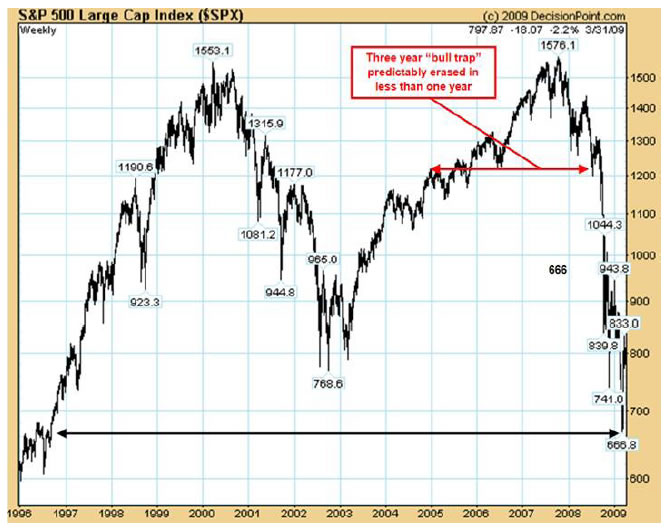
As these economic realities sank in, investors increasingly abandoned the “irrational complacency” that had characterized investor sentiment over the past couple of years and sold more and more of their equity holdings. The decline in the stock market that had started at the final high in October 2007 accelerated to the downside in the second half of 2008 and into the recent March 6, 2009 low, nose-diving some 58% at the low to date.
In fact, not only was the entire overvaluation in stock prices during the “bull trap” from late 2004 through late 2007 more than completely erased (the red line in the chart below), consistent with our forecast during that time (see our further discussion below), but all stock-market gains for the 12 years since early 1997 were wiped out (the black line in the chart below). That is to say, investors lost – not once, but twice – all of their stock-market gains from the final three years of the mania (1997-2000) forward.
Thus, any investment manager who made even $1 of gain for their equity investors during this time by correctly anticipating and positioning their investments to avoid – and better yet, to profit from – this stock-market decline ranks among the top performers in the country. To have done so with relatively low risk means the risk-adjusted performance is even higher.
At the same time the stock market made new lows, having declined 58% from its October 2007 high (as has the diversified equity portion of investors’ portfolios), all of the client accounts of a registered investment adviser client of ours made new highs, using our research, forecasts, and individual account advice. Further, for the 9-year period from the March 2000 high, our research shows that well over 90% of investors lost money in equities, and of the remaining investors, well over 90% experienced interim portfolio declines (drawdowns) many times greater than -10%. In comparison, one of our investment adviser clients achieved positive, double-digit returns for each of their privately managed account clients using our advice and never exceeded their 10% drawdown target (excluding fees) in any client’s account. We believe this puts that risk-adjusted performance in the top 1% over the past nine years.
There is tremendous significance for us in the fact that all stock-market gains were wiped out since 1997. That is exactly the year we called the start of a roughly 12- to 20-year period of essentially no gains for stocks we term a Supercycle Bear Market Period.3 Some 12 years later, this forecast has proven true. No other investment strategist in the world made this exact call. (See further discussion of this forecast below.)
The Three-Year “Bull Trap” Advance Completely Reversed
As we frequently discussed in our market commentaries, the stock market’s extended advance from the 2004 post-election, year-end bounce until late 2007 was never justified by economic fundamentals. The ultimate vindication of our view is that the entire three-year advance was wiped out in a matter of weeks. We had warned that the market advance, a classic, but lengthy “bull trap4,” which rose on the back of several years of rampant speculation, would eventually be rapidly and more than completely wiped out – and it was, as seen in the chart on the previous page.
3 A Bronson Asset Allocation Cycles (BAAC) Supercycle Bear Market Period is a 12- to 20-year period of underperformance during which bear markets, anticipating economic recessions, as well as the recessions themselves typically are at least twice as frequent and twice as severe in magnitude and duration as during Supercycle Bull Market Periods. Such a period begins when the return on money market funds sustainably exceeds the total return on equities, especially when downside-volatility-risk is taken into account. Further details are found in our research paper, “Bronson Asset Allocation Cycles,” available on request.
4 A bull trap is a period of modestly higher highs that lures investors back into the market, only to be followed by a resumption of the market decline. A bull trap is baited by investor emotion from hope, greed, or complacency, which leads investors to pile into the market despite all fundamental warning signs to the contrary.
That market advance was driven primarily by the apparently positive results of the excessive leverage used by both individuals and companies during that period – especially by companies in the financial sector – and was particularly evident in:
• the raging, unchecked speculation in the highly leveraged financial contracts known as derivatives,5
• the leveraged and dysfunctional execution of stock buybacks,
• debt-leveraged mergers and acquisitions, especially private-equity deals, and
• the debt-leveraged housing-market bubble.
The so-called “strong earnings” of the period, which supposedly supported the stock-market advance, were fueled primarily by the highly profitable, but highly speculative creation and sale of derivatives. These financial-sector profits were never going to be sustainable.
In fact, it was the unwinding of precisely these lucrative, but highly speculative financial instruments (derivatives) that crippled or destroyed financial institutions around the world and led to the staggering string of events that required the most massive government (read: taxpayer) bailouts in history, brought the credit markets to a standstill and the global financial system close to collapse, and plunged the U.S. into a recession far more severe than any economic downturn since the Great Depression. (Further below we discuss our 1997 forecast of the implosion of derivatives.)
The stock-market advance from late 2004 through late 2007 was never justified by the true condition of the economy or corporate profits. The increasingly overpriced stocks of the period were not suitable for value investors. The stock market has dropped by 58% since October 2007, as has the diversified equity portion of investors’ portfolios, revealing the fact that their investment managers had a momentum-oriented – not value-oriented – investment style, regardless of what was claimed, and did little more than ride the market up, then ride it back down again.
5 Derivatives are highly leveraged financial contracts whose values are tied to underlying stocks, bonds, commodities, currencies, or loans, or linked to specific events like changes in the weather or interest rates. They are widely used both as insurance against market losses and for leveraged speculation. They have the unintended consequence of linking – through increased correlation and heightened volatility - otherwise disparate capital markets, asset classes, and investment styles, especially when investors demand liquidity during extreme panic selling. See also footnote 8 on page 8.
The Importance Of A Strong Conceptual Framework
We have long stressed the critical importance of investment managers having a deep, fundamental, and unbiased grasp of the economy and financial systems, with which to competently analyze and reasonably accurately anticipate significant changes in the capital markets. Without such a strong conceptual framework, we said that investment managers would be doomed to fail, as they have now failed, in rapidly and dynamically changing economic and market conditions about which they admit they are “confused.”
We approach the capital markets with just such a strong conceptual framework. We were one of the only investment strategists to conclude in the late 1990s, using both contemporaneous and historical data, that the nearly two-decade period of outsized stock-market gains dating from 1982 was approaching an end and a 12- to 20-year period of essentially no net gain for the stock market was in the process of arriving.
In a landmark report we wrote in July 1997, entitled “The Case for the Third Supercycle Bear Market Period of This Century,” we summarized our stock-market outlook and detailed a large number of factors from our forecasting models6 supporting it. We warned that during the coming Supercycle Bear Market Period, we could expect bruising bear-market declines, vastly increased market volatility, and overall stock-market returns that would underperform no-risk money market instruments, like U.S. Treasury bills.
As the chart on the next page shows, our forecasts were right on the mark. It clearly shows the extended period of no net gain during the current Supercycle Bear Market Period, as well as previous ones, shaded in pink. As noted above, our Supercycle Bear Market Period expectation of a minimum of 12 years of no net gain in the stock market has now been met. The oscillator in the bottom panel shows that the stock market’s even longer, rolling 16-year rate of total return is also approaching 0%.
Among other forecasts in that 1997 report that have particular relevance today:
• We originally forecasted that during the Supercycle Bear Market Period, “the U.S. stock market faces [an] enormous [decline] on the order of -67% (plus or minus 12%), at least twice the severity of the average bear market.”
The NASDAQ index already reached the low end of that target range when it dropped 78% during the 2000-02 decline. We believe substantial declines are still ahead for both the NASDAQ and S&P 500 indexes in the remainder of the current second downleg of the Supercycle Bear Market.
• In 1997 we wrote: “We will experience increasingly violent swings up and down in stock prices…until a final selling panic, involving global capital markets simultaneously.”
Investors have witnessed greatly increased volatility in the U.S. stock market, as well as synchronous moves across the global markets, in day-to-day trading and in the market trends and counter-trends over the past nine years. In 2008 alone, the U.S. stock market experienced the fifth and sixth largest percentage gains and four of the 20 largest percentage losses in stock-market history. We expect the greatest volatility – probably record high volatility – to occur in the final selling panic, which we believe is close at hand.
• More than a decade before the cumulative, unbridled speculation in derivatives caused the current credit crisis, we warned in our 1997 report:
“Investments are far more leveraged today than in 1929…. Investors can effectively borrow more than 99%...through derivatives. … Rather than used as a hedge for defensive purposes, they are too often used aggressively to place speculative, leveraged bets on the direction of markets...We believe that the… trend-following strategy of ‘dynamic hedging’ popular today represents a greater meltdown risk than ‘portfolio insurance’ did in 1987 [leading up to the Crash] – more because of rollover illiquidity than counter-party failures.”
This is exactly what happened in the 2008 market meltdown of the derivatives known as “credit default swaps7,” which caused global credit markets to seize up and stock markets to go into tailspins worldwide.8
7 A credit default swap (CDS) is a credit derivative contract between two counterparties. The buyer makes periodic payments (premium leg) to the seller, and in return receives a payoff (protection or default leg) if an underlying financial instrument defaults. CDS contracts have been compared with insurance because the buyer pays a premium and, in return, receives a sum of money if a specified event occurs. However, there are a number of differences between CDS and insurance. In a so-called naked CDS, which amounts to a purely speculative side bet, the buyer
of the CDS does not need to own the underlying security or have any insurable interest. In fact, the buyer does not even have to suffer a loss from the default event. Naked CDSes, which comprise some 86% of the $29 trillion nominal amounts in CDSes, have finally been recognized by both regulators and legislators as a moral hazard, for which the proverbial chickens have already come home to roost.
8 More than 10 years ago we predicted that the misunderstanding and misuse of the correlation coefficient, used by all the correlation trading desks trading derivatives, would lead to a derivatives crash. Now some are claiming that is exactly what has happened. More on this fascinating subject is available upon request.
• We also warned in our 1997 report:
“Americans are far more involved in derivatives than they realize. Their pension funds, mutual funds, insurance companies and banks have been using them many times more extensively than a decade or so ago. More than 50% of the profits of some major banks in recent years has come from their marketing and use of all types of derivatives. A Supercycle Bear Market is linked inextricably to a collapse in derivative trading volume – …each [is partially] the cause and effect of the other.”
The confirmation of this forecast has been made painfully clear in the recent meltdown of credit default swaps, especially the naked credit default swaps (see footnote #8), and the impact of the failure of those derivatives on financial institutions and the credit markets.
• Concerning the economic contraction linked to the Supercycle Bear Market, we wrote: “Like the late 1920s and the mid-1960s, the coming stock-market decline will probably trigger a recession in the U.S., which in turn will trigger a contagion of additional international recessions due to the increased interdependency of world capital markets and economies.”
Following a recession in 2001,9 which was more shallow than average (having been cut short by the massive economic stimulus immediately following the 9/11 terrorist attacks), a second, far more severe recession, with far more widespread, global repercussions, is not only still unfolding, but is worsening at an ever greater rate. As we discuss further below, economists as a whole completely missed the magnitude of the economic deterioration, believing on the whole that the U.S. economy would either avoid a recession or experience a minor one lasting only a couple quarters.
Finally, we wrote in our 1997 report about several myths that had been popularized by Wall Street and the financial media during the stock-market mania of the late 1990s. These self-serving notions promoted the view that the way the stock market operates had fundamentally changed, that the bull market would continue indefinitely and that, therefore, investors could continue to buy and hold equities without any concern.
We wrote that these permabullish concepts would all be indisputably disproven during the Supercycle Bear Market Period – and, indeed, they have been. Among them, you will undoubtedly remember the following:
9 The last recession, which was designated as a eight-month recession in 2001 by the NBER, actually dragged on for 31 months, according to our more thorough application of the NBER’s own standards for determining recessions, which are the factors the Conference Board uses in its coincident indicators index, adjusted for growth in population or the labor force. The chart of the Conference Board’s index (see our First Quarter 2008 commentary) is clear as a bell in showing a 31-month recession. The NBER decided to stick with its initial determination of an eight-month recession even after the government issued
• Concerning the self-serving mantra “I’m in for the long haul” that Wall Street drummed into investors, we wrote: “Buy-and-hold is not an adequate long-term strategy for most investors. We expect that the coming [Supercycle] Bear Market will bring almost complete consensus on this point….”
Investors who have held stocks over the past 12 years are learning this painful lesson.
•Concerning economists’ promulgation of a permanently rising, New Era Economy:
“One myth is that as long as we are in a ‘Goldilocks economy,’ with corporate profits rising moderately and with inflation and interest rates remaining low, the business expansion and the bull market will continue indefinitely.” 10
Inflation and interest rates have remained low and gone even lower since we wrote this in 1997, but two business-cycle contractions, accompanied by plunging corporate profits, have occurred nevertheless since this notion held sway with economists.
• This one was very popular with financial planners: “Another myth…is that Baby Boomers’ retirement needs will guarantee cash inflows to mutual funds for years, thus fueling a continuous bull market.”
As we more correctly forecasted, Baby Boomers have instead drastically cut back on their spending and begun to pay down debt in preparation for retirement. Instead of increasing, cash flows to mutual funds have declined substantially.
• In 1997, a particularly backward-looking theory of asset allocation was extremely popular with financial planners, about which we wrote:
10 From the late 1990s through the stock-market high in March 2000, Wall Street inundated investors with bullishly-biased half-truths about the economy and stock market to give them a rationale for continuing to buy and hold overpriced stocks. Among the now-debunked nonsense circulating at the time was the notion that there was no longer any risk in owning stocks over bonds – no “risk premium” – because stocks had always outperformed bonds over periods of 10 to 15 years, so if investors would buy and hold stocks for 10 to 15 years or longer, the stock market could rise indefinitely. This notion was immortalized in a popular book of the time, entitled Dow 36,000, which ironically was published in late 1999 just before the dot.com bust and severe stock-market plunge that the authors argued would never happen again. Prior to the book’s publication, we made a bet with the lead co-author, economist Kevin Hassett, director of economic policy studies at the American Enterprise Institute. Hassett was only willing to bet that the stock market would grow at least 7% on average for the next 10 years – not that it would reach his Dow 36,000 target. We took the position that the risk premium had not permanently gone to zero, that it was highly cyclical over multiple time horizons, that its cyclicality is more important than earnings or the price-to-earnings (P/E) ratio in forecasting future stock-market performance, and that based on that knowledge, we were forecasting the stock market would have a 12- to 20-year period of essentially no net gain and heightened volatility that we call a Supercycle Bear Market Period (or half a Bronson Asset Allocation Cycle).We won the bet on April 2.
“One final myth propelling the bull market is the so-called Efficient Frontier… The Efficient Frontier optimization…is dangerous to investors because, in effect, it overweights the relatively recent best-performing asset classes, which already have risen relatively strongly and which, therefore, will likely have greater losses during inevitable periods of market declines and/or underperformance… One could argue that the value investor should do the exact opposite of what the Efficient Frontier recommends.”
In retrospect, it is easy to see that investors should have done the exact opposite of what the Efficient Frontier recommended, just as we wrote. In the late 1990s, Efficient Frontier optimization dictated that investors’ asset allocation should be heavily weighted towards stocks, which had been the best-performing asset up to that time. Of course, investors who followed this then-fashionable theory have sustained horrific losses. That looking in the rearview mirror would fail during the current Supercycle Bear Market Period was an easy call for us.
Navigating A Supercycle Bear Market
Having correctly anticipated a 12- to 20-year period of essentially no net gain for the stock market, which we call a Supercycle Bear Market Period, we further laid out the path the stock market was likely to take during the period. In particular, we laid out the geometry of the most severe combination of bear markets of the period, the so-called Supercycle Bear Market, which typically runs from the highest to lowest point during the Period.
Supercycle Bear Markets have a down-up-down, ABC zigzag pattern, as seen earlier in the chart on page 7 and in the chart below of the current and two previous non-world war Supercycle Bear Markets, where their magnitudes and durations have been fractally rescaled (that is, equalized in magnitude and duration) in order to make the similarities of the patterns more apparent. The current Supercycle Bear Market (the bold bright blue line) has been overlaid on the two previous ones, showing that it is right on track. (The two world-war Supercycle Bear Markets, not shown here, have a similar down-up-down, ABC pattern.)
As you can see, the first downleg, or “mania bust” (A) is followed by an exuberant rebound phase, or “echo-mania” 11 (B). Investors’ “irrational exuberance” during the original mania becomes “irrational complacency” during the echo-mania, as investors continue to buy stocks in the face of a deteriorating economy. The echo-mania rebound half the time hits slightly higher, record highs before reversing and declining again in the second, even more devastating second downleg, or echo-mania bust (C), which is currently well underway and most probably
11 An echo-mania is the exuberant rebound phase between the first and second downlegs of a Supercycle Bear Market, in which the “irrational exuberance” of investors during the initial mania becomes “irrational complacency” during the echo-mania.

not yet finished. That decline typically ends in a classic selling panic – what we more precisely call a “mass-correlation, hyper-volatility, illiquidity event,” or MCHVIE (pronounced mac-vee).
The reason for the viciousness of the second, follow-on decline (C) in a Supercycle Bear Market is explained by reference to investor emotions. When investors, who think they learned a lesson from a previous, severe decline they never saw coming, find themselves again losing money in a second, brutal decline they never saw coming, they then – and only then – become completely disillusioned and bail out of their stocks en masse. This causes the second downleg of Supercycle Bear Markets to be particularly devastating, typically ending in a full-blown MCHVIE.
Investors and investment managers who failed to understand the geometry of this major, once-in-a-generation stock-market correction not only suffered catastrophic losses, but further compounded those losses by buying back into the market much too soon. Characteristic of a Supercycle Bear Market, value investors who stepped in to buy stocks at any point during the mania bust, echo-mania rebound, or echo-mania bust have lost money on their investments, as can be seen in the chart on page 3.
The Rest Of The Supercycle Bear Market Period
In our landmark 1997 report, “The Case for the Third Supercycle Bear Market Period of the Century,” we laid out in broad strokes a number of key events that would occur during the period, and these events have been unfolding in the years since. While exact details could not be known in advance, recent events are no surprise to us. The crises now emerging are just the specific manifestations of conditions we have been anticipating and warning about all along. We have discussed and benchmarked many of these developments in the commentaries we send our clients. We continue to monitor events closely.

Our analysis strongly points to a substantial further decline in the stock market, for which those following our advice are positioned to continue to profit. Further, we are prepared for the decline to end in a MCHVIE. We described a MCHVIE and how and why it develops in some detail in our March 2001 commentary.
In short, it is an extraordinarily savage sell-off, in which virtually all investment strategies become unprofitable, almost all asset classes decline sharply, and it all happens simultaneously across multiple capital markets. Its devastation is wreaked by the herding effect of massive numbers of panicked investors ultimately bailing out of any and all investments at any price en masse in rapidly declining markets. It is the ultimate selling panic that ends major bear markets.
We have already experienced shades of such a selling panic when the market declined between 7% and 8% in a single day on each of four different occasions in late 2008. The final selling panic will probably decline by a significantly greater magnitude.
Once we believe the bottom of this decline – the second downleg of the Supercycle Bear Market – has been reached, we will make major changes in our recommendations to position our clients to profit from the subsequent bull market. The stock market at that point will meet our value-oriented criteria. Since we can make money in both up and down markets, we can call the markets as we see them, recommending various asset classes only when they are truly a value and avoiding the kind of catastrophic losses investors have incurred by missing or ignoring the warning signs of major reversals in market trends.
As soon as we have made recommendations to position our clients for the subsequent bull-market advance, we will actively be gauging the magnitude and duration of that bull market, aware that history shows it is likely to be shorter and weaker than average. This is because it will be a bull market in an ongoing Supercycle Bear Market Period that will include post-shock recession(s). Additionally, it will be a bull market that will be anticipating what we believe will be a particularly sluggish economic recovery, in which the growth in consumer and business spending – and, therefore, the growth in corporate profits – will be relatively weak.
From our study of Supercycles, we know we can expect at least one or two more bear markets during the remainder of the Supercycle Bear Market Period. The coming bear market(s) will likely be more severe than average, but of lesser magnitude and duration than the current Supercycle Bear Market, which is the most severe combination of bear markets during the overall, 12- to 20-year period of no net gain in the stock market. Each bear market will also likely lead to another business-cycle contraction, each of which is likely to be a more severe recession than average, as is also typical in Supercycle Bear Market Periods.
The Recession Continues To Accelerate To The Downside
In our commentaries over the past several years, we discussed the slowing growth of the U.S. economy in some detail. As we wrote concerning the leading economic indicators12
18 months ago in our May/June 2007 commentary: “The foremost, ‘long-leading’ indicators turned down more than two years [earlier] and the ‘short-leading’ ones 14 months [earlier], suggesting a recession is already in its early stages.”
We went on to present charts of key economic components of U.S. gross domestic product (GDP) that were already clearly in recession at that time, including housing (actually all of private fixed investment13) and autos. While employment is not part of GDP, it is an important factor in determining the phase of the business cycle, and we demonstrated that it, too, was in recession (contraction). As discussed further on page 24, while other economists and investment strategists were still looking for a “soft landing” and continued “strong earnings,” we forecasted the 2007 peak and decline in corporate earnings, which is another very important business-cycle indicator that we use, but the NBER does not in its recession dating.
Finally, addressing a then-popular view among economists and on Wall Street that the U.S. would avoid recession by business spending offsetting the slowdown in consumer spending, we presented a chart that showed business-spending growth had been decelerating for two years and was then hovering around 0%. We wrote:
“There is no valid indication of any reacceleration. A continuing drop in business capital spending, combined with the continuing slowdown in consumer spending, supports our view that the economic contraction, now in the early stages, will be a particularly severe one.”
12 Leading economic indicators are comprised of various measures of business conditions that tend to lead the overall economy by an average of about two quarters, although the historical range has been mainly from zero to more than four quarters.
13 Private fixed investment is comprised of investment in residential (new houses) and nonresidential (commercial and industrial) structures and business equipment and software.
In our subsequent Summer 2007 commentary, we addressed the then-prevalent view among economists and investment strategists that higher growth in the global economy would prevent a U.S. recession. We wrote:
“This notion is also absurd. The rest of the world is simply not strong enough to boost our exports enough to offset the deepening slowdown in both U.S. consumer and business capital spending…. Far more importantly, the U.S. is responsible for a good chunk of the growth [in the global economy]… Rather than bailing out a faltering U.S. economy, countries around the world will find their own growth pulled down along with the U.S. economy.
Of course, by now it is apparent that the severe, synchronized global recession we had been forecasting is well underway. Most of the major economies in the world are already in severe recession.
By the time of our First Quarter 2008 commentary, we had transitioned from presentation of the leading to presentation of the coincident economic indicators. The top chart on the next page is from that commentary, showing that the Conference Board’s coincident indicator index (the solid black line in the chart), adjusted for population growth (or per capita), had peaked in August 2007 and had been declining since then. A per-capita adjustment eliminates growth in the population (or labor force) from the data because it is not reflective of true expansion or contraction in the business cycle. This was again clear confirmation to us that a recession was already underway.
In contrast, the consensus outlook of economists and investment managers all during this period was for continued slow growth – a “soft landing” – and not a recession. The chart has been updated below to show the continuing, very steep decline in the coincident indicator index, clearly showing that the business cycle is still contracting rapidly and is already deeper – more severe – than the previous recession, in further confirmation of our forecast.
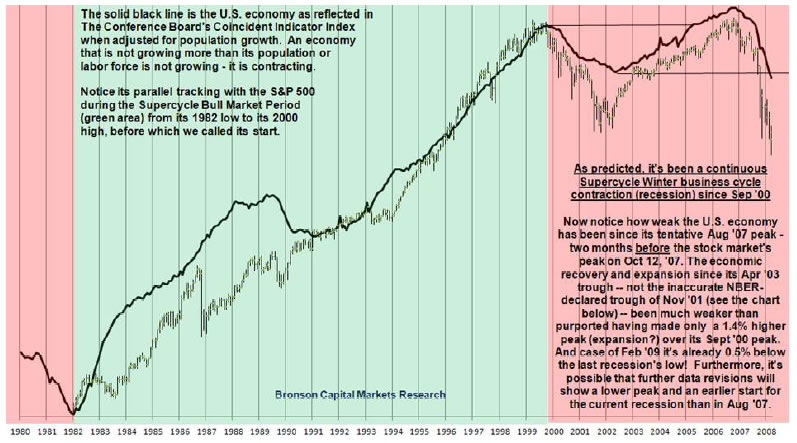
With a per-capita adjustment, the peak in the index – and, therefore, a logical start of the recession – is August 2007. Without that adjustment, the nominal peak is October 2007. The National Bureau of Economic Research, using a more limited set of factors, decided the recession started in December 2007. We believe that the normal, periodic revisions of government economic data over the next several years, which will almost certainly continue to be downward revisions, will probably support an even earlier start.
No matter which of these starting dates one wants to use, the recession was clearly underway and worsening all through 2008. It is, then, a cautionary tale for investors that economists and investment strategists as a whole completely misread the economy, grossly missed the start of the recession, and were totally unprepared for the predictable severity of its magnitude, believing up until very recently that the economy would experience nothing more than a “soft landing” in 2007, and certainly no recession.
In fact, other professional prognosticators were so far off the mark that as recently as September 2008, when the recession had already been underway for nine months according to the NBER’s reckoning and for 13 months by our determination, fully one-third of economists surveyed still believed that the U.S. was neither in recession nor close to it!14
Keep that in mind the next time you hear economists and other financial pundits confidently state they see signs that the recession is bottoming. In fact, there continues to be an acceleration to the downside in a broad range of economic indicators, including gross domestic product15, corporate earnings, housing prices, auto sales, and employment, some of which we discuss further below. Taken together, the data confirm that the severe recession underway has much further to go before bottoming and that once it finally bottoms, with the extraordinary economic and financial damage occurring, the economy will be extremely slow to recover.
14 The optimistic bias of economists was revealed in a recent study of the consensus forecasts of economists made in advance of 60 recessions around the world in the 1990s. It showed that economists failed 97% of the time to predict the coming contraction a year in advance, and on the rare occasions they did, they significantly underestimated the severity of the economic downturns. Many of the economists failed to foresee recessions that occurred as soon as two months later. In the present instance, the quarterly survey conducted by the National Association for Business Economics showed that fully one-third of U.S. economists failed to recognize a recession that had already been underway at least nine months.
15 Gross domestic product is the measure of the nation’s total output of goods and services.
We believe investors are still too unrealistic and overly optimistic about the potential success of recent policy-maker interventions, even though they are the most massive U.S. government intervention since World War II by the U.S. Treasury Department, the Federal Reserve Board, and the U.S. Congress. We believe investors will eventually get fed up with intervention and its costs and will become increasingly more pessimistic about the future. This anticipated deterioration in investor sentiment further supports our view that the stock market will decline to significantly lower lows in this second downleg of the Supercycle Bear Market.
The Current Economic “Perfect Storm”
While the sheer ferocity of the recession has caught Americans – including professionals whose job it is to forecast them – by surprise, we forecasted this severity well in advance. In a section of our Year-End 2006 commentary entitled, “As Bad As It Gets: The Coming Economic ‘Perfect Storms’,” we wrote about the extremely ominous implications of the approaching and rare convergence of the downtrends of five significant economic and stock-market cycles.16
We had previously presented (in our May 2002 commentary) a forecasting model we developed years ago, which integrated four widely-recognized business/economic cycles with the Bronson Asset Allocation Cycle, which measures the secular bull and bear stock-market periods we have quantified and identified as Supercycle Bull and Bear Market Periods. Our model not only explains the past interrelationship of all these cycles with a high degree of accuracy, which is a minimum condition for any meaningful model, but it also has been a useful tool in forecasting the future – and highly accurate in having forecasted the current economic meltdown.
The chart on next page is a stylized illustration of this model, or Stock-Market and Economic Cycle Template (SMECT), which incorporates these five economic and stock-market cycles:
• the roughly three-generation (64-year) Kondratieff cycle of inflation and interest rates;
•the roughly 32-year Bronson Asset Allocation Cycle of stock-market over- and underperformance;
•the roughly 16-year Kuznets cycle of infrastructure development (now tracked by the National Income and Product Accounts – which Kuznets created in the late 1940s – as “private fixed investment” [see footnote #13]);
•the roughly 8-year Juglar cycle that reflects the true business cycle; and
•the 48-month Kitchin cycle, which originally reflected inventory cycles, but now more importantly reflects the coordination of the presidential election and stock-market cycles.17
16 By “cycle” is meant one uptrend followed by one downtrend, or vice versa, not a fixed time period.
17 Kondratieff, Kuznets, Juglar, and Kitchin were all prominent economists. Kuznets won the Nobel prize in economics for his work. The fact that these economic cycles are not routinely referred to in present-day U.S. financial discourse in no way diminishes their ongoing importance.
In our Year-End 2006 commentary, we again referred to this model, warning that the U.S. economy was entering a unique time frame, during which we would face the negative, synchronized, and compounded interactions of the downtrending phases of all five of these cycles, not once, but three times in the subsequent eight years through 2014.
• The Kondratieff cycle is in its deflationary economic phase: a severe recessionary period with declining interest rates and declining rates of inflation (disinflation) eventually becoming outright deflation, especially debt deflation, before its end around 2014.
• The Bronson Asset Allocation Cycle will remain in a Supercycle Bear Market Period until roughly 2014, during which time bear markets and the recessions they signal can be expected to be more frequent and severe than average.
• The Kuznets cycle, which includes residential housing, clearly peaked in 2005, has been in recession since then, and can be expected to decline into roughly 2014.
• The Juglar business cycle peaked in 2000 at the end of the previous expansion, experienced a recession, recovered, and now includes a second recession, after which the business cycle can be expected to recover and then decline again into roughly 2015-6.
• The Kitchin political/stock market cycle is in decline, and will likely rebound and cycle again two more times through roughly 2014.
Clearly, a serious economic downturn is well underway and now widely recognized by the consensus, but the full extent of the current economic “perfect storm” has not yet been priced into the stock market. The stock market will only bottom when this occurs. For example, failed derivatives will have to be fully written off before the credit crisis ends; homeowners and homebuilders will have to lower their asking and selling prices even further and write off their losses before the housing bust will end; and so on. We anticipate a further, substantial stock-market decline will occur as investors finish this job.
By Bob Bronson
Bronson Capital Markets Research
bob@bronsons.com
Copyright © 2009 Bob Bronson. All Rights Reserved
Bob Bronson 's 40-year career in the financial services industry has spanned investment research, portfolio management, financial planning, due diligence, syndication, and consulting. At age 23, he and his partner founded an investment research firm for institutional clients and were among the first to use mainframe computers for investment research, especially in the areas of alpha-beta analysis and risk-adjusted relative strength stock selection. Since 1967, he has served as an investment strategist and consultant to various investment advisory firms and is the principal of Bronson Capital Markets Research. If you wish to read more, read his BIO
A note to visitors ~ We do not have a website, but we maintain a private e-mail list. I'm also often asked why we provide research and forecast information for free. Since we are not looking for new business from the internet, I periodically post some of our research and forecasts in exchange for feedback from others. And since we don't publish in academic or industry trade journals, such internet discussion gives us as much peer review as we want and can conveniently assimilate at this time.
Also, the few archiving discussion boards in which I have the time to participate give us new ideas and allow us to establish and maintain intellectual property copyrights for our proprietary research, and to establish a verifiable forecasting record. At the same time, we are able to publicly document our forecasts and help others who otherwise don't have access to our work.
To be added to our private e-mail list, we only ask that you periodically provide feedback: questions, comments and/or constructive criticism to keep our research work and forecasts as error-free, readily comprehensible and topically relevant as possible. If you would like to be added, please explain, at least briefly, what you do, since our e-mailing list is categorized by the backgrounds of the recipients.
Robert E. Bronson, III Archive |
© 2005-2022 http://www.MarketOracle.co.uk - The Market Oracle is a FREE Daily Financial Markets Analysis & Forecasting online publication.