


Current Stock Market Rally Within Supercycle Stocks Bear Market Part 2
Stock-Markets / Stocks Bear Market May 12, 2009 - 08:58 PM GMTBy: Bob_Bronson

 Continued from Part 1 - GDP Continues To Accelerate Its Decline
The Commerce Department recently revised gross domestic product (GDP) downward for the fourth quarter of 2008. It shows the nation’s output of goods and services declined at a 6.3% annual rate, adjusted for inflation, from the previous quarter. It is clear confirmation that the recession is accelerating. Real GDP declined at the sharpest rate since 1982, while nominal GDP (no inflation adjustment) declined at the sharpest rate since 1958. The biggest hit to GDP came from the 4.3% annualized drop in consumer spending, the largest component of GDP. Business and residential investment also had large declines, and the deepening global recession took a toll on U.S. exports.
Removing inventory changes, government spending, and foreign trade leaves the portion of GDP directly relevant to the true condition (phase) of the business cycle. Further adjusting for population or labor force growth (because an economy not growing faster than its population or labor force is not expanding) results in the business-cycle portion of GDP per capita having fallen 2.0% from its peak in the fourth quarter of 2007, and down at a greater and accelerating 4.8% annualized rate during the fourth quarter of 2008, as seen in the chart on the next page. It is very similar to the Conference Board’s index of coincident economic indicators (see the chart on page 16), as it should be.
The steep drop in the consumer and business spending portions of GDP and in the Conference Board’s coincident indicators is consistent with our long-standing forecast, discussed in every commentary over the past several years, that the recession now underway would be global and much more severe. This is because, unlike the previous recession, which was caused primarily by a slowdown in business spending, this recession is the result of cutbacks in both business and consumer spending, and consumer spending alone at its peak comprised 72% of U.S. economic activity.
Corporate Earnings Are Still Declining Sharply, As Forecasted
In our Year-End 2006 commentary, we presented the top chart on page 23, which showed that corporate earnings, as measured on a Generally Accepted Accounting Principles (GAAP) earnings-per-share basis for the S&P 500 companies, were at the top of a reliable, 76-year-long, high-low volatility channel. Based on the months-long slowdown in the growth rate of earnings then underway, as well as other factors in our forecasting models, we wrote that earnings were “only a few quarters from peaking.”
While other economists and investment strategists at the beginning of 2007 were still looking for a “soft landing” and continued “strong earnings,” we forecasted a substantial drop in profits for that year:
“From previous peaks at the top of the high-low volatility channel, earnings dropped 37% from 1988-90 and 54% from 2000-01. We are looking for another significant decline in earnings to begin in 2007 as economic conditions deteriorate more rapidly.”
In fact, corporate earnings per share did peak two quarters later – in the second quarter of 2007 – and declined significantly the rest of the year, consistent with our forecast. Predictably, the recession started later the same year.
The following year, at the beginning of 2008, the consensus of economists and investment strategists was still for no worse than a short and shallow economic slowdown, with a recovery in earnings in the second half of the year. In contrast, in our First Quarter 2008 commentary, we forecasted a continuation of the decline in corporate earnings throughout 2008 and beyond, for a total decline of at least 40% to 50% over six to eight quarters from the second-quarter 2007 peak. Our very much then-contrarian forecast has now proven true.
Our updated chart at the bottom of page 23 shows earnings have continued to drop off a cliff, as it became abundantly clear that all the massive global intervention by governments and central banks could not stop the severe global recession from accelerating to the downside. Already, the huge “kitchen sink” write-offs in the fourth quarter of 2008 by corporate managements hoping to put their problems related to the recession and the credit crisis behind them caused widely-watched trailing four-quarter S&P 500 earnings per share to be down a whopping 67% from their peak in the second quarter of 2007. What’s more, by the third quarter of this year, the drag on earnings from that dismal fourth quarter of 2008 will cause the trailing four-quarter S&P earnings per share to be down by more than 100%!
Long-Term Price-To-Earnings Ratios Are Still Declining Sharply
The most widely used measure of under- and over-valuation of stocks is the price of stocks in relation to corporate profits, or the price-to-earnings (P/E) ratio. In our research into Supercycles, we demonstrated that the market P/E ratio is highly cyclical, rising to an extreme high by the end of Supercycle Bull Market Periods, then falling to an extreme low by the end of Supercycle Bear Market Periods, as investors’ appetite for the risk of owning stocks waxes and wanes over time.
It was relatively straightforward, therefore, for us to forecast that P/E ratios would drop to a level of extreme undervaluation from the level of extreme overvaluation at the market high in March 2000, when the smoothed18 market P/E ratio of the S&P 500 reached 33 – by far the greatest overvaluation in U.S. stock-market history.
At the time of the market mania high, we wrote in our March 2000 commentary that overvalued stocks “do not return to normal levels on a smooth glide path by what is called ‘reversion to the mean.’ Instead, like a pendulum, valuations swing through the long-term mean to a level as proportionally undervalued as they were previously overvalued. We describe this as ‘reversion to the extreme.’”
Our long-standing forecast for P/E ratios, as found in our April 2001 commentary, has been “for P/E ratios to drop from record highs – a high of 33 for the S&P 500 – to far below their long-term average of about 15 by the end of the current Supercycle Bear Market Period. For example, the P/E ratio for the S&P 500 at the end of the previous Supercycle bear market period was around 8.”
Our long-term chart of the channel in which properly smoothed P/E ratios have oscillated since 1870 first appeared in our November/December 2001 commentary, as reproduced again at the top of page 25. Note the blue dotted arrow pointing to an ultimate low for the (smoothed) stock-market P/E ratio of below 10.
18 The stock-market P/E ratios in this chart are 50% exponentially smoothed, which is similar to a three-year moving average. Smoothed market P/E ratios have predictive value for stock prices that non-smoothed P/E ratios do not. In our P/E Predictor Study I, we demonstrated that 50% exponential smoothing is the optimal way to evaluate market P/E ratios to get the strongest forecast of stock-market performance, which turns out to be over the subsequent 10 to 20 years in Supercycle Bull and Bear Market Periods.
Now, compare these long-standing expectations with a current chart of the market P/E ratio below. The decline in the P/E ratio to extreme levels of undervaluation is well underway.
The chart below shows more current, monthly data through March 2009. Notice that the market P/E ratio has already fallen well below its 139-year up trending average of 18 and has steepened its decline, well on its way to extreme levels of undervaluation and confirming our Supercycle forecast.
We have also pointed out frequently in our commentaries that while corporate earnings typically decelerate and eventually decline during the bear markets of Supercycle Bear Market Periods, the devastating damage done to stock prices during the Period is due more to the collapse in P/E ratios than to lower corporate earnings. The price of stocks (P) equals the price-to-earnings ratio (P/E) times earnings (E). With both P/E ratios and corporate earnings (E) still in sharp decline, the implications for stock prices (P) ahead is still quite negative.
House Prices Continue To Decline Sharply, As Forecasted
Consistent with our long-standing expectation of a deflationary trend during the current Supercycle Bear Market Period, we have been forecasting what we have termed The Great American Home-Equity Bust since the summer of 2000 – long before housing analysts or economists had any thought of a housing bust. We were the first to warn that as home prices declined over a period of years, ultimately some 50% of American homeowners with mortgages would have their home equity completely wiped out and would be upside-down on their mortgages (that is, owing more on the mortgage than the home is worth), creating an extraordinarily negative wealth effect19 in the economy. And we stood virtually alone in expecting this to occur during a period of falling – not rising – interest rates. (See our further discussion below on pages 36-37.)
In our Summer 2006 commentary, we presented Yale economist Robert J. Shiller’s chart of American home prices since 1890, adjusted for inflation (as reproduced here again below), which gave a long-term perspective to the recent housing bubble. To it, we added arrows to indicate our forecast of an ultimate decline in home prices of at least 20% to 40%, which would bring home prices back in line with more reasonable valuations.
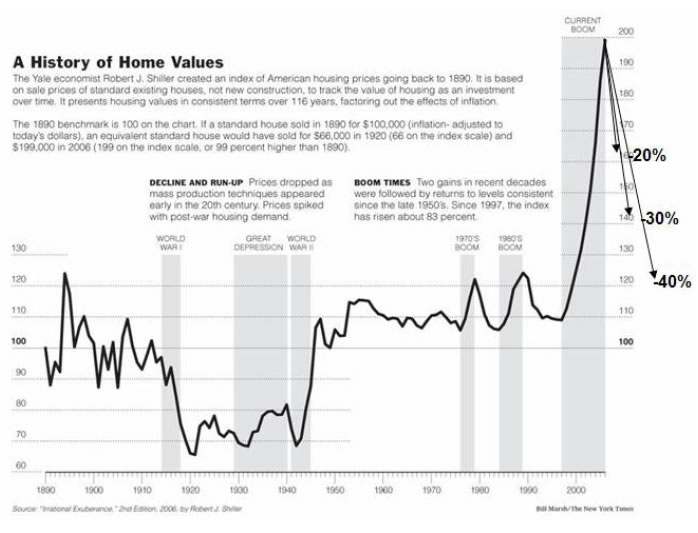
19 Negative wealth effect refers to the phenomenon of consumers spending less when they feel less wealthy – especially when the value of their stocks and/or real estate has declined significantly.
We also discussed in our November 2005 commentary the fact that homebuilders, who as “insiders” are a leading indicator for the overall housing industry, were becoming drastically more pessimistic, signaling an impending plunge in home prices. The chart below was our presentation at the time of the National Association of Home Builders’ (NAHB) housing market index (the blue line on the chart), along with our expectation that the index would plummet (the blue dotted arrow), with an ultimately devastating effect on the economy and stock market. Further, because the index has been a very reliable leading indicator for the stock market, we wrote that it also signaled an upcoming steep decline in the stock market (the black line in the chart).
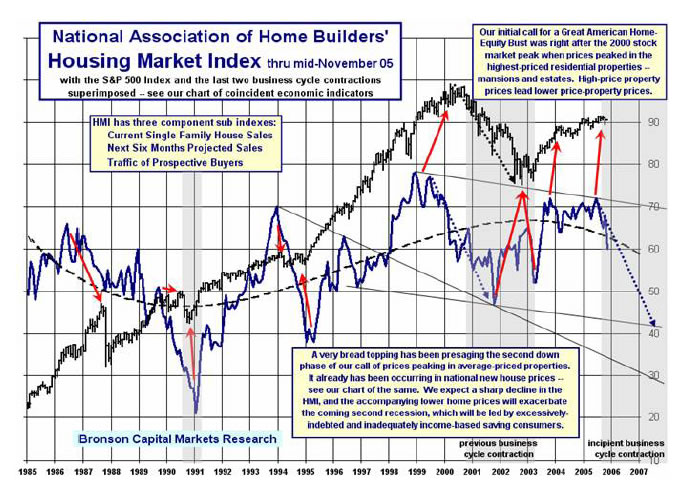
Comparing the chart above with the current chart of the NAHB data on the next page shows the accuracy of our forecast for both the housing market (the blue line) and the stock market (the black line).
When we presented charts showing that the price of the median American home (new and existing) finally peaked in late 2005 and had started declining, the vast majority of economists and investment strategists were still in denial that there even was a housing bubble, believing instead that the housing sector of the economy would continue to be strong and drive the economy. In our view, a housing bust was underway.
By our Summer 2006 commentary, we had combined new and existing home sales prices into our own “all-home” price indexes, seen in the chart on the next page, showing that the median all-home price peaked in October 2005 (the bright blue dotted line) and that the growth rate of the median all-home price (the bright blue line in the bottom panel) had been plunging since then, suggesting that a much further, steeper decline in U.S. home prices was immediately ahead.
While the inevitability of a housing bust is perfectly clear with 20/20 hindsight, at the time we wrote this, the consensus among economists and investment strategists was that the decline in housing prices had already bottomed and would recover in the second half of 2006. Among the popular arguments used to support that view was the fact that the aggregate value of housing had not declined in any calendar year since the Great Depression, so it could not do so then.
As the current chart of the data on the next page shows, the consensus view was very wrong. Home prices have already declined to our target range. The bottom panel of the chart shows that the price of the median U.S. home has already declined 27.2% through February 2009. It has further been estimated that more than 25% of homeowners with mortgages currently owe more than their home is worth, which is well on the way to our forecast of 50%.
We expect a much further decline to come from the continuing downward pressure on prices from foreclosures, which are lowering comparable values for the whole neighborhood, and from inventory (both properties currently listed for sale and those that are pending) having to be cleared out before the bust is over.
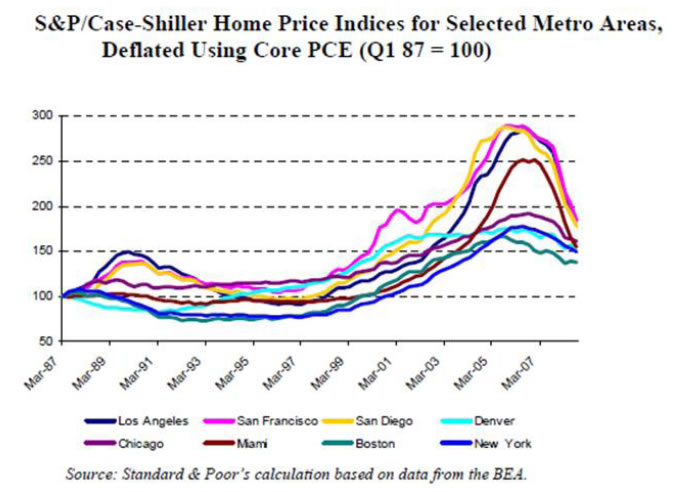
Yale University economist Robert Shiller, a leading housing-market expert, concurs with our outlook on prices. In a recent interview, he noted that housing prices could not possibly be nearing a bottom because they are currently accelerating to the downside. The steepening decline in prices in several of his widely followed metro-area S&P/Case-Shiller home price indexes can be seen in the chart on the next page.
Auto Sales Gave Early Warning Of An Economic Calamity
Auto sales are the largest component of retail sales, which in turn is the largest component of consumer spending. Since World War II, the sales of autos, among the most expensive durable goods, have been a near-perfect barometer of economic activity, which is why we have been highlighting auto sales in our commentaries over the past several years.
In our May/June 2005 commentary, we presented the chart on the next page, with an arrow showing that we expected sales to decline significantly from the roughly 17,000,000 unit level at that time. Because declining auto sales is one of the most reliable indicators of a recession we also wrote: “Auto sales are signaling that consumer spending definitely is slowing, consistent with our view that the upcoming recession will be led primarily by overly-indebted consumers cutting back on their spending.”
As we then noted in our Summer 2006 commentary, the -2% year-to-year growth rate reached at that time in dealer sales of new and used cars, parts, and service (adjusted for inflation) is the level that historically has signaled the U.S. economy is entering, or is already in, a recession, further supporting our expectations of recession.
Our forecasts have proven true. The chart of auto sales on the next page shows that monthly sales (the thin bright blue line) did drop from the roughly 17,000,000 units per year level at the time of our May/June 2005 commentary to around 9,000,000 units in January 2009. With the U.S. also having entered a recession, auto sales again proved to be a reliable early warning system.
Our Forecast Of Sharply Lower Stock Prices Coupled
With Drastically Lower Interest Rates Is Confirmed
Because lower interest rates are generally a stimulus for economic growth, and certainly were during the 1980s and 1990s, investors have erroneously come to believe that they always signal a stronger economy, higher corporate profits, and a rising stock market. However, in our landmark 1997 report, we wrote: “Low interest rates do not guarantee a stock market rise or prevent a decline. Interest rates lower than our current rates did not prevent bear markets in the 1930s, 1940s, 1950s and 1960s – and in particularly, did not prevent the most devastating one in 1929-32.”
More recently, we discussed this point extensively in our October 2007 commentary, as the Federal Reserve Board was aggressively lowering interest rates. We wrote:
“The Fed’s recent, aggressive lowering of interest rates underscores the seriousness of the continuing weakness in the housing market and of the broadening of the incipient recession. It is also belated recognition that the banking system and credit markets are still under considerable strain from the ongoing defaults in the subprime and prime mortgage markets and from other related fallout. This alone should challenge investors’ belief that lower interest rates are always good for the stock market.”
We went on to explain: “As it happens, during deflationary Supercycle Bear Market Periods, like the current one, interest rates and the stock market decline together overall – that is, they are positively correlated….” Below is the chart presented at that time, now brought up to date, showing the close correlation during the current Supercycle Bear Market Period between the stock market (the dark blue line) and the long- and short-term U.S. Treasury rates plotted below it.
Finally, as we wrote in October 2007, which was the month in which the stock market peaked and began the current decline:
“Investors err when they believe that the relationship between interest rates and the stock market that existed during the previous Supercycle Bull Market Period [1982-2000] – that is, lower interest rates and higher stock prices (and P/Es)…will continue today. Just as the last investors into the stock market at the high in 2000 had the greatest losses, investors who jumped into the market in recent days, weeks, months, quarters, and even years will soon rue their decisions….”
In the 16 months since the chart above was first presented, interest rates have dropped significantly lower, while the stock market has already declined 58%, continuing to confirm the positive correlation between the two during a Supercycle Bear Market Period, as we correctly anticipated. And investors who continued to hold stocks have rued their decisions.
We developed the unique schematic and table below to explain the all-important relationships between the economic seasons of the Supercycles within Bronson Asset Allocation Cycles20 and various fundamentals. Notice that falling interest rates -- that is, rising bond prices – are bearishly correlated with the stock market’s long term P/E ratio during ultimately deflationary economic Supercycle Winters, as is occurring currently. Very few investors (including professionals) understand that the stock market’s long-term P/E ratio is not positively correlated with the net present value of cash flows (dividends and/or earnings) during Supercycle Winters and the Springs that follow, as is incorrectly taught in post-graduate college courses.
20 A Bronson Asset Allocation Cycle (BAAC) is composed of one Supercycle Bull and one Supercycle Bear Market Period (defined in footnotes 1 and 3) in either order.
U.S. Dollar Continues To Decline Sharply From 2000, As Forecasted
We have written frequently in our Market Commentaries about our expectation of a long and substantial decline in the U.S. dollar. In July 2000, we wrote:
“The U.S. dollar reached its highest value against the value of its trading partners’ currencies in 1985. From that high, it declined more than 50% over the next 10 years to a low in April 1995….. We believe the five-year rally from that low, which retraced about 40% and now appears to be over, is an unsustainable rebound in an ongoing downtrend. While the dollar rallied sharply from 1995 into 1997, it has underperformed money market funds since then. We believe the dollar has peaked and is resuming its decline now.”
The chart below shows the accuracy of our 2000 forecast. The red arrow represents the linear best-fit line21 of all the data since our forecast, which is consistent with our expectations.
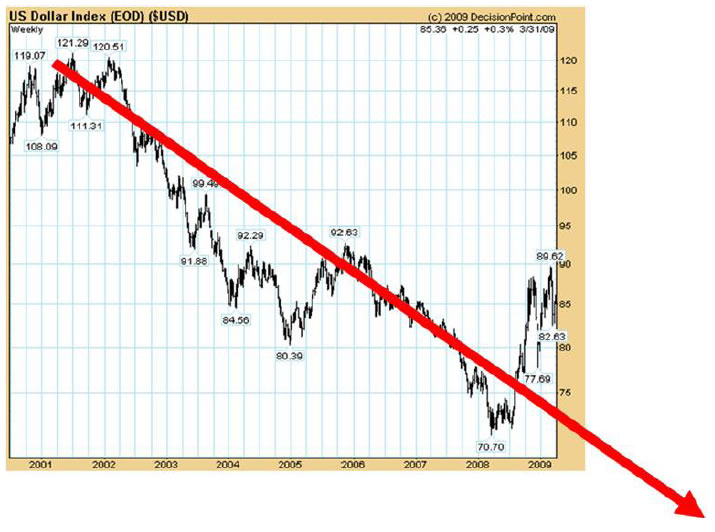
21 A best-fit line is the straight or curved line which gives the best approximation to a given set of data. Mathematically, it is the line that reduces the sum of the squared deviations of the actual data points from the line to the smallest amount.
In our July/August 2005 commentary, we detailed four key fundamental factors that we believe will continue to drive the dollar lower:
• the enormous U.S. trade deficit22 and current account deficit,23
• differentials in inflation-adjusted (real) interest rates,24
• ongoing adjustments in purchasing power parity,25 and
• the rebalancing of central banks’ portfolios to reduce their more than double over-ownership of the U.S. dollar relative to the United States’ 30% share of global GDP (production).26
In our opinion, these serious imbalances will continue to weigh on the exchange rate of the dollar for the foreseeable future. As these fundamental imbalances are corrected, the dollar can be expected to decline to substantially lower, all-time lows over the next several years.
The value of the dollar has become less certain in light of the huge budget and trade deficits that the U.S. has racked up in recent years, prompting foreign central bankers and monetary policymakers to consider changing the dollar as the only global reserve currency, a position it has held since the Bretton Woods Agreements were signed immediately following World War II. The success of the euro, which incorporated a number of currencies, is viewed as further impetus for the change.
Recently a U.N. panel has recommended the world replace the U.S. dollar as its reserve currency in favor of a basket of currencies. That is, instead of a single reserve currency, it would be a widely shared reserve currency. The European Union and China have indicated they would like their currencies, the euro and yuan respectively, to play a significant role in any basket of trading bloc-based currencies.
Meanwhile, Russia favors the creation of a new reserve currency to be issued by international financial institutions. Russia has already significantly reduced the share of the dollar in its reserves in recent years.
22 The U.S. trade deficit is an economic form of debt owed to foreigners – the cumulative result of years of U.S. imports exceeding exports.
23 The U.S. current account deficit is a measure of the excess of national spending over national income in the U.S. balance of payments, and is the broadest gauge of the nation’s global trade.
24 Higher real interest rates increase the demand for a currency because of the greater investment returns available. Notwithstanding the Federal Reserve Board’s hikes in short-term rates, we believe that U.S. long-term interest rates will remain relatively low for years to come for various reasons.
25 Purchasing power parity (PPP) refers to the cost equivalency of goods and services between nations and their currencies. It is the single most important long-term factor in determining the relative exchange value of currencies, but it usually only comes into play when trade imbalances are being corrected, like now. Globalization has led to the offshoring of jobs by U.S. corporations seeking to stay competitive by employing cheaper foreign labor. This puts downward pressure on the exchange value of the U.S. dollar, the currency in which U.S. workers are paid, thus narrowing the huge differential in global wages. The labor PPP between high-cost American labor and low-cost Asian labor will take many years to fully adjust – that is, to find a stable differential, or equilibrium between them.
26 We believe that central banks rebalancing their portfolios will de-emphasize the dollar in favor of the euro, the Japanese yen, the Chinese yuan, emerging pan-Asian currencies, and even gold. Central banks are all the more likely to include the Chinese yuan in their portfolios, now that China has agreed to float their currency and likely will eventually establish parity with the Hong Kong dollar. We fully expect the rebalancing of central banks’ portfolios ultimately to usher in a new global currency regime, effectively a Bretton Woods III, in which the U.S. eventually and formally recognizes the marketplace’s substantial devaluation of the dollar as the reserve currency of the world
These preliminary discussions are consistent with our view of a significantly lower dollar, which still remains in a long-term downtrend despite a rally in recent months that is likely over now, as seen in the chart on page 37. Those following our advice are well-positioned to continue to profit from this decline.
Bronson Capital Markets Research May 8, 2009 SPX 929
Bob Bronson Wins A 10-Year Bet With The Author of Dow 36,000
From the late 1990s through the stock-market high in March 2000, Wall Street inundated investors with bullishly-biased half-truths about the economy and stock market to give them a rationale for continuing to buy and hold overpriced stocks.
Among the now-debunked nonsense circulating at the time was the notion that there was no longer any risk in owning stocks over bonds – no “risk premium” – because stocks had always outperformed bonds over periods of 10 to 15 years. So if investors were buying and holding stocks for 10 to 15 years or longer, the stock market could rise indefinitely.
This notion was immortalized in a popular book of the time, entitled Dow 36,000, which ironically was published in late 1999 just before the dot.com bust and severe stock-market plunge that the authors argued would never happen again. The book got worldwide attention and was discussed seriously in financial and academic circles and on the front page of The Wall Street Journal.
Prior to the book’s publication, Bob Bronson contacted the lead co-author, economist Kevin Hassett, director of economic policy studies at the American Enterprise Institute, to get a copy of his manuscript, which Hassett provided. After Bob read it, critiqued it, and discussed it with Hassett (and other economists, including Yale University economics professor Robert Shiller, best known at the time for having coined the phrase “irrational exuberance”), Bronson and Hassett made a wager.
Hassett was only willing to bet that the stock market would grow at least 7% on average for the next 10 years – not that it would reach his Dow 36,000 target. Bob took the position that the risk premium had not permanently gone to zero, that it was highly cyclical over multiple time horizons, that its cyclicality is more important than earnings or the price-to-earnings (P/E) ratio in forecasting future stock-market performance, and that based on this knowledge, Bob was forecasting a 12- to 20-year period of essentially no net gain and heightened volatility in the stock market that he calls a Supercycle Bear Market Period (or half a Bronson Asset Allocation Cycle[1]).
The 10 years was up on April 2, and since over the ten years the S&P 500 Index declined 36%, or at an annual compounded rate of more than 4%, Bob has collected on the bet. Hassett sent him a bottle of one of the country’s finest reserve wines, the Caymus Special Select Cabernet Sauvignon. And Hassett says he wants to stay in closer contact with Bronson.
[1] A Bronson Asset Allocation Cycle (BAAC) is composed of a Supercycle Bull and a Supercycle Bear Market Period.
By Bob Bronson
Bronson Capital Markets Research
bob@bronsons.com
Copyright © 2009 Bob Bronson. All Rights Reserved
Bob Bronson 's 40-year career in the financial services industry has spanned investment research, portfolio management, financial planning, due diligence, syndication, and consulting. At age 23, he and his partner founded an investment research firm for institutional clients and were among the first to use mainframe computers for investment research, especially in the areas of alpha-beta analysis and risk-adjusted relative strength stock selection. Since 1967, he has served as an investment strategist and consultant to various investment advisory firms and is the principal of Bronson Capital Markets Research. If you wish to read more, read his BIO
A note to visitors ~ We do not have a website, but we maintain a private e-mail list. I'm also often asked why we provide research and forecast information for free. Since we are not looking for new business from the internet, I periodically post some of our research and forecasts in exchange for feedback from others. And since we don't publish in academic or industry trade journals, such internet discussion gives us as much peer review as we want and can conveniently assimilate at this time.
Also, the few archiving discussion boards in which I have the time to participate give us new ideas and allow us to establish and maintain intellectual property copyrights for our proprietary research, and to establish a verifiable forecasting record. At the same time, we are able to publicly document our forecasts and help others who otherwise don't have access to our work.
To be added to our private e-mail list, we only ask that you periodically provide feedback: questions, comments and/or constructive criticism to keep our research work and forecasts as error-free, readily comprehensible and topically relevant as possible. If you would like to be added, please explain, at least briefly, what you do, since our e-mailing list is categorized by the backgrounds of the recipients.
Robert E. Bronson, III Archive |
© 2005-2022 http://www.MarketOracle.co.uk - The Market Oracle is a FREE Daily Financial Markets Analysis & Forecasting online publication.