


The More the Fed Delays Cutting US Interest Rates, the More We Cut Our GDP Forecast
Economics / US Economy Jun 06, 2007 - 02:44 PM GMTBy: Paul_L_Kasriel
 The Federal Open Market Committee (FOMC), the monetary policy arm of the Federal Reserve, has communicated that it is quite content to hold the federal funds rate at 5-1/4% for an extended period despite four consecutive quarters of sub-par real economic growth and a moderation in core consumer inflation (i.e., excluding food and energy components). Why is the FOMC content to remain on hold? Because it has a forecast calling for enough of a rebound in economic growth later this year to avoid a recession and it desires further moderation in core inflation.
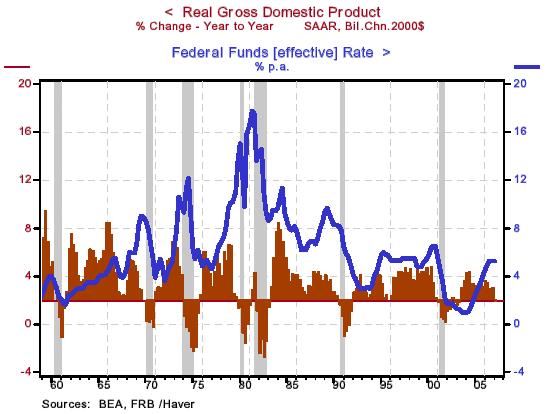
We believe the FOMC will get its wish with regard to core inflation, but are less certain that its forecast of Gross Domestic Product (GDP) growth will pan out. One of the reasons we doubt the FOMC's forecast will pan out without a little interest rate “self-help” is that it never has since 1960. Chart 1 shows that since 1960, every time year-over-year real GDP gets around where it is now, 1.9%, the FOMC has engineered a federal funds interest rate cut. Sometimes these funds rate cuts have come in time to revive the economy. Other times the cuts have come too late to prevent a recession. This time, according to the FOMC and numerous economic forecasters, it will be different: we will experience an immaculate economic recovery. Bit we doubt it.
Chart 1
In our May economic update, we had assumed the FOMC would begin paring the federal funds rate in early August and finish at the end of October, for a cumulative cut of 75 basis points. As a result, we believed this would start to tilt the “nose” of the economy up by the fourth quarter of this year. Our real GDP growth forecast for 2007 on a Q4/Q4 basis in May was 1.9%. We now are lowering that forecast, in part because of the downward revision to first-quarter growth and in part because the FOMC is likely to delay cutting the federal funds rate. We do not see the first cut in the federal funds rate coming until October 31. Because of this delay in dropping the federal funds rate, we have lowered our second-half real GDP forecast to 1.7% vs. last month's 2.25%. On a Q4/Q4 basis, our 2007 real GDP forecast is now 1.6%. Because of our lower real GDP forecast, we have now penciled in a cumulative decline in the federal funds rate of 100 basis points, with the last 25 basis points coming in mid-March 2008.
New estimates of inventories played a large role in the Commerce Department's downward revision of first-quarter real GDP growth to 0.6% from its advance estimate of 1.3%. And we expect inventories to play a large role, along with federal government defense spending, in accounting for the pick-up in second-quarter growth to about 2.3%. However, we see sharp deceleration in the growth of real personal consumption expenditures to 2.0% in the second quarter from 4.4% in the first quarter. We believe the recession in the housing market is slowly spilling over to consumer spending as a result of slower employment growth and slower home-equity appreciation.
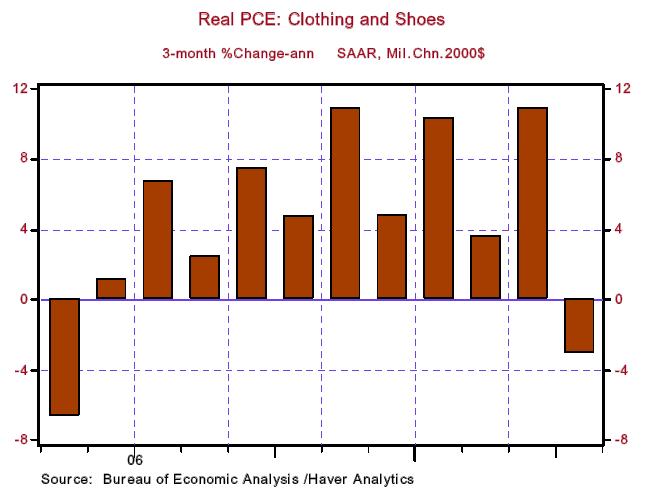
With regard to consumer spending, growth in the real spending for consumer durable goods slowed to 1.94% annualized in the three months ended April. This compares with growth of 12.36% in the three months ended January. Officials at U.S. auto makers have said the recession in the housing market is beginning to brake demand for their products. As Chart 2 shows, light motor vehicle sales have been stair-stepping downward since the beginning of the year. Durable goods related to housing, such as furniture and household equipment, also have seen the rate of growth in their purchases tail off (see Chart 3). Even growth in spending on clothing and shoes, which tends to be somewhat discretionary, has slowed sharply in the past three months (see Chart 4).
Chart 2
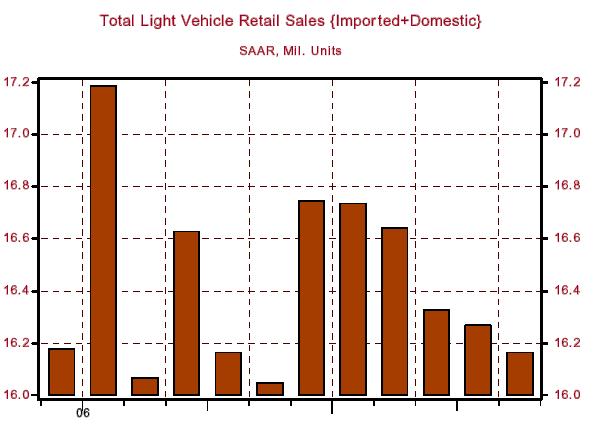
Chart 3
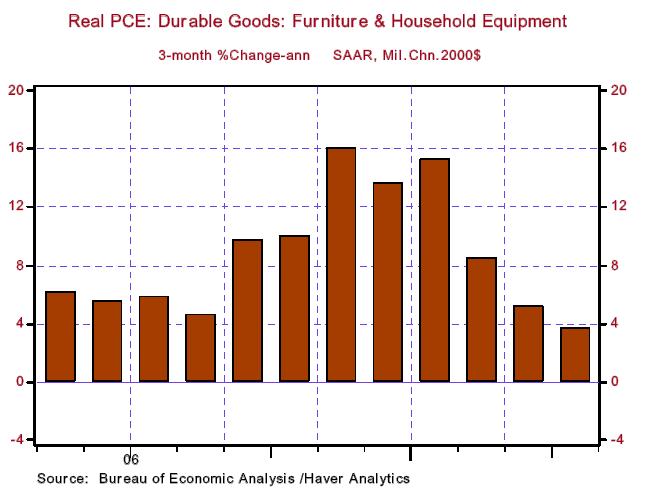
Chart 4
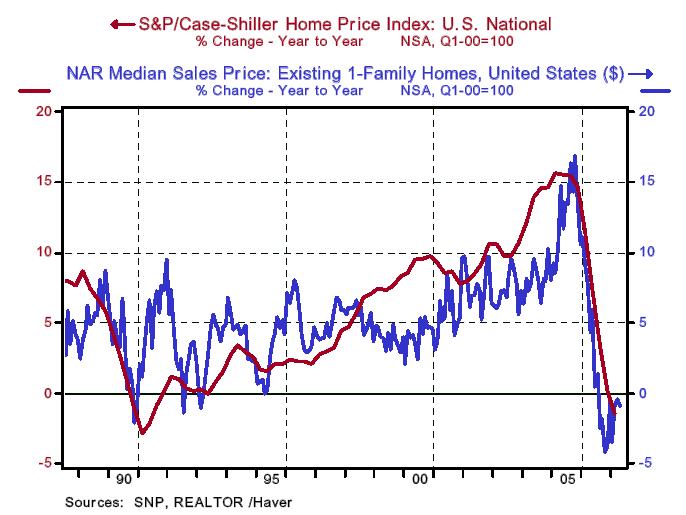
Households have been funding their deficit spending by selling assets – including selling their direct and indirect holdings of corporate equities back to corporations – and by borrowing the equity in their houses. Although there are no signs of a slowdown in corporations buying back their shares (although there is a sign that profit growth is slowing), there are definite signs that the home equity growth is slowing due to the national decline in house prices (see Chart 5).
Chart 5
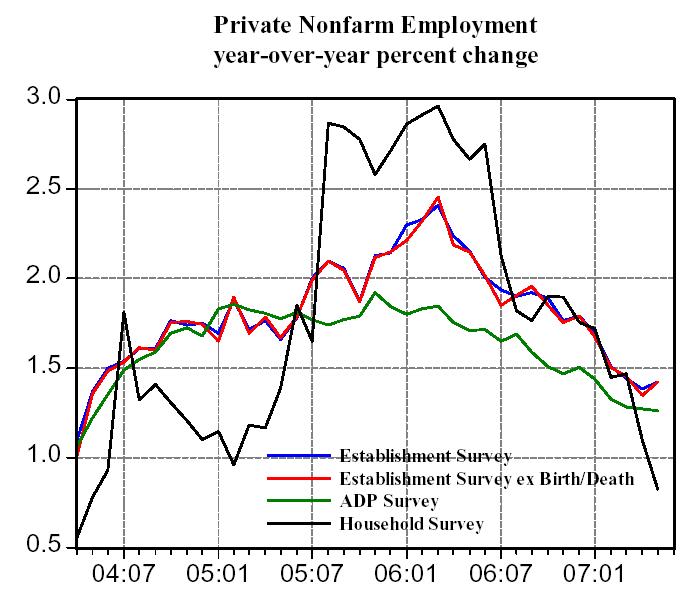
The recession in housing is beginning to have a negative impact on employment growth. There are at least four measures of private nonfarm employment. The most popular is the series calculated by the Bureau of Labor Statistics (BLS) from its Establishment (business) survey. This series includes the so-called birth/death adjustment, an adjustment made by the BLS to attempt to capture hiring by business start-ups that are not yet in the Establishment survey. We have created a series that removes this birth/death adjustment (see Will the Real Private Nonfarm Payrolls Please Stand Up? ). Another measure of private nonfarm employment is available from the BLS Household survey. And Automatic Data Processing, Inc. (ADP) in conjunction with Macroeconomic Advisers publishes a series on private nonfarm payrolls. All these series are painting a similar picture now – slower employment growth (see Chart 6). With an important funding source for consumer spending – home equity – drying up it also would be reasonable to expect the slowdown in employment growth to begin curbing personal consumption expenditures (PCE).
Chart 6
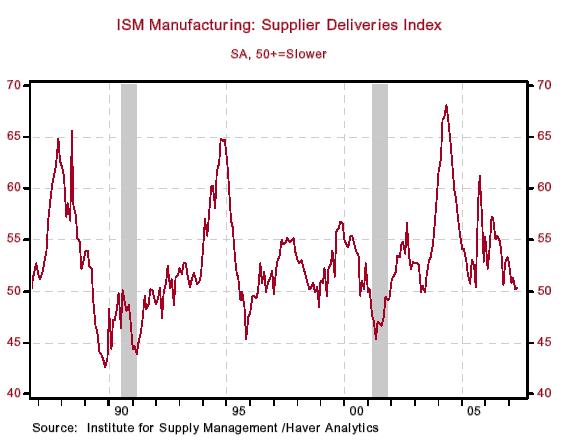
We mentioned that inventories, which played a role in depressing first-quarter real GDP growth, likely will play a role in boosting second-quarter growth. But we would not look for sustained increases in inventory-building in the second half of the year. If we are correct about growth in consumer spending slowing, then merchants will not be in a hurry to restock their shelves. Evidently, there are few production bottlenecks in the industrial sector, save for oil refineries. The lack of bottlenecks is illustrated by the declining trend in the Institute for Supply Management (ISM) Supplier Deliveries index for manufacturing (see Chart 7). Moreover, purchasing managers in the manufacturing sector report that no materials are in short supply.
Chart 7
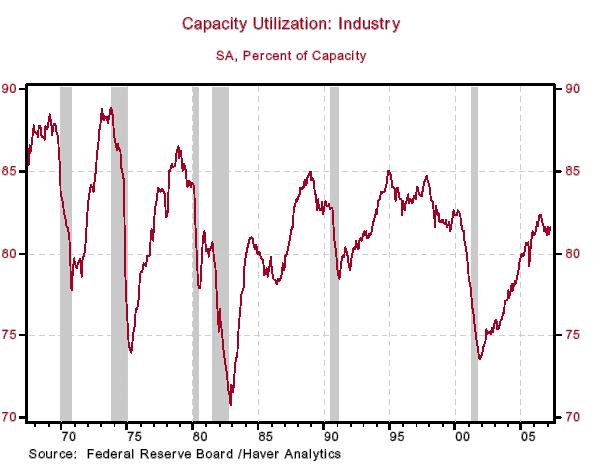
There seems to be some renewed stirring in the area of business capital spending. As in the case of inventories, we do not see this as a long-lived phenomenon. Why? As we discussed in our May 21 daily commentary (see Economy May Wake Up Without Consumers' Prodding? ) growth in business capital spending lags growth in household spending. So, if household spending is slowing, with a lag, capital spending is likely to slow, too. But with profits still soaring, surely businesses will want to put more of their cash to work by expanding their scale of operations, right? Wrong. First, profit growth is slowing, as shown in Chart 8. Second, as we showed in the May 21 commentary, profit growth tends to have no effect on business capital spending when household spending is considered. Third, industrial capacity utilization is relatively low in an historical context and already off its cyclical high (see Chart 9). So, it is not exactly as though U.S. businesses are bursting at their productive seams.
Chart 8
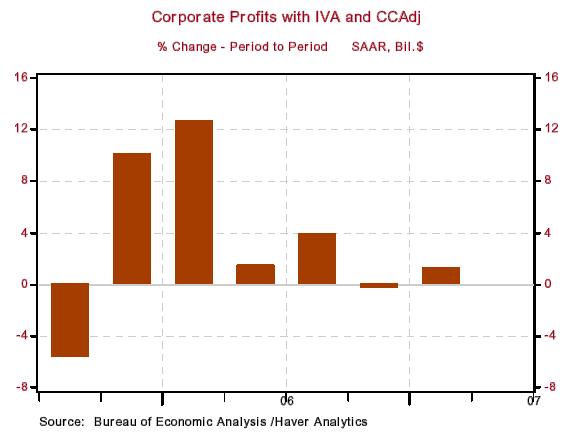
Chart 9
In sum, we do expect a single-quarter rebound in inventory accumulation and capital spending growth. But after the second quarter, we see these two factors waning in their contribution to real GDP growth.
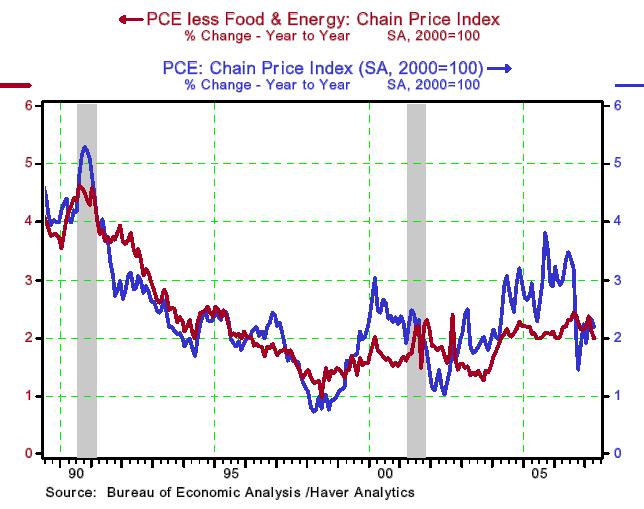
Although the FOMC continues to fret about increases in the prices of goods and services, the rate of increase in these prices has moderated in recent months – both including and excluding the prices of food and energy (see Chart 10). Through the rhetoric of its members, we on the outside have divined that the FOMC would not be comfortable until the rate of increase in the core PCE price index, which excludes its food and energy components settles into a range of 1% to 2%. If you look carefully at Chart 10, you can see that the April year-over-year change in this price measure is 2.0%. Also, if you look at Chart 10, you will see that in the two previous business cycles, the rate of change in consumer prices did not peak until after the economy had entered recession (the areas shaded in gray). We guess that is why the rate of change in consumer prices is considered a lagging economic indicator.
Chart 10
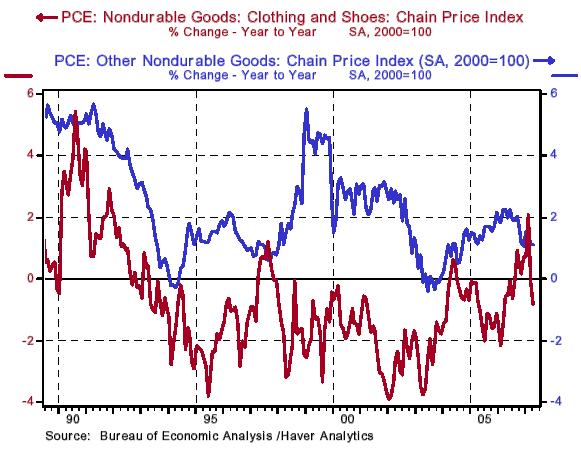
You might think that with the rise in energy and industrial commodity prices in recent years, and the fall in the foreign exchange value of the U.S. dollar, that prices of consumer goods would be rising at a faster rate. But you would be incorrect. Chart 11 shows that on a year-over-year basis, the prices of durable goods are falling. Chart 12 shows that prices of clothing and shoes, products that are heavily imported, have started to fall. Chart 10 also shows that the rate of increase in the prices of other nondurable goods excluding food and energy has begun to moderate.
Chart 11
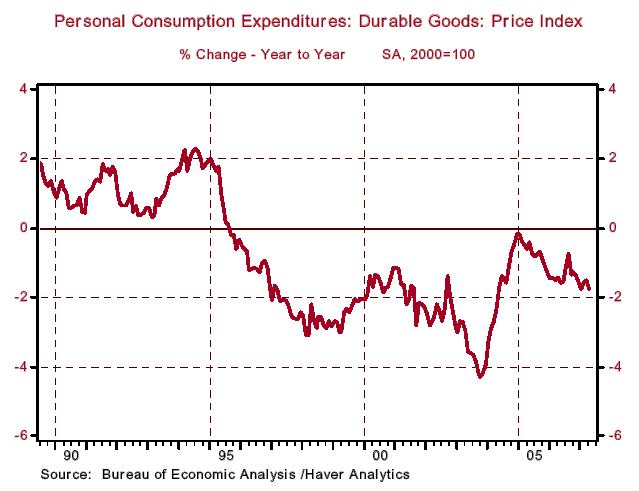
Chart 12
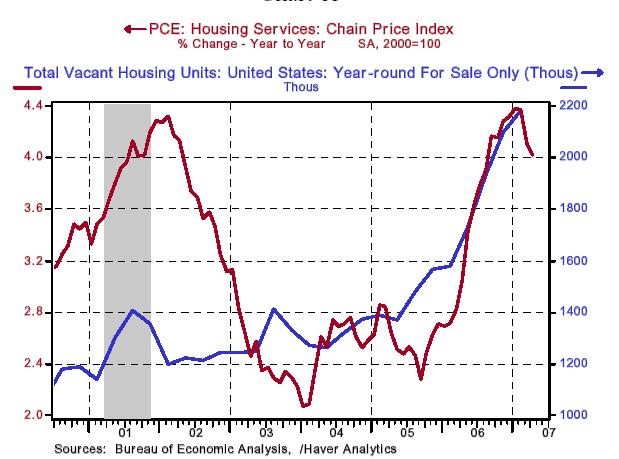
In the area of consumer services, increases in the price of housing or shelter services – the explicit rent on apartments and houses and the implicit rent on owner-occupied housing – had, until recently, been contributing to more rapid increases in the PCE price index. However, as shown in Chart 13, there are signs that the rate of increase in shelter rents has peaked. This is not very surprising inasmuch as there are 2.2 million vacant housing units – a record high - waiting to be purchased by owner-occupiers. Many of these vacant houses and condominiums are owned by a new class of landlords – “accidental” landlords, formerly known as “flippers.” These landlords now unexpectedly have mortgage payments, property taxes, insurance premiums and, in the case of condos, owners' assessments to pay. They likely will be willing to let their housing units at below-market rents just to get a little help with their monthly payments.
Chart 13
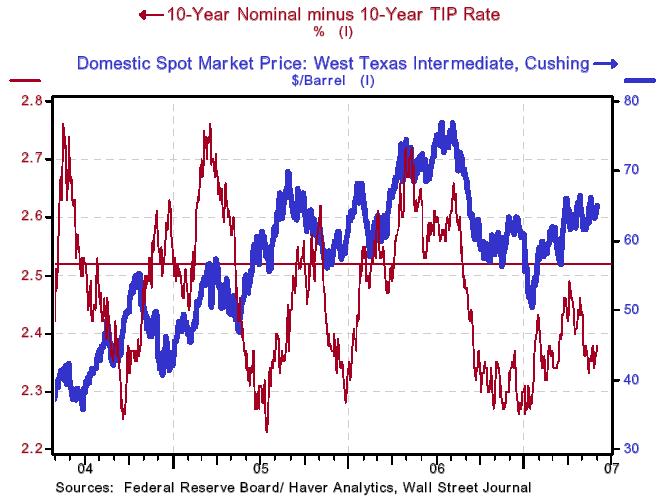
The FOMC repeatedly talks about the need to keep in check not only actual consumer price increases, but also the public's expectations of those price increases. How is the FOMC doing in this respect? Pretty well. When the FOMC embarked on its latest cyclical boosting of the federal funds rate on June 30, 2004, the spread between the yield on the 10-year Treasury security and the yield on the 10-year Treasury inflation-protected security was 2.52 percentage points. This yield spread is a proxy for bond investors' expectations about the rate of increase in the Consumer Price Index (CPI) over the next 10 years. Chart 14 shows that this yield spread has narrowed to 2.38 percentage points despite a $29 increase in the price of a barrel of crude oil.
Chart 14
In conclusion, we believe the housing recession has not yet run its course and that its fallout is spreading relentlessly to other parts of the economy, most notably, the consumer sector. The second-quarter economic-growth rebound, feeble as it likely will be, will represent a false dawn. In the interim, increases in the prices of core consumer goods and services will moderate further. On October 31, the day the FOMC meets, the Commerce Department will release its advance estimate of third quarter real GDP. Our bet is that third-quarter growth will be on the low side of the FOMC's expectations. Of course, the FOMC will have evidence suggesting that prior to October 31. But with the official evidence in hand on that date, we believe the FOMC will commence cutting the federal funds rate.
*Paul Kasriel is the recipient of the 2006 Lawrence R. Klein Award for Blue Chip Forecasting Accuracy
THE NORTHERN TRUST COMPANY
ECONOMIC RESEARCH DEPARTMENT
June 2007
SELECTED BUSINESS INDICATORS
By Paul L. Kasriel
The Northern Trust Company
Economic Research Department - Daily Global Commentary
Copyright © 2007 Paul Kasriel
Paul joined the economic research unit of The Northern Trust Company in 1986 as Vice President and Economist, being named Senior Vice President and Director of Economic Research in 2000. His economic and interest rate forecasts are used both internally and by clients. The accuracy of the Economic Research Department's forecasts has consistently been highly-ranked in the Blue Chip survey of about 50 forecasters over the years. To that point, Paul received the prestigious 2006 Lawrence R. Klein Award for having the most accurate economic forecast among the Blue Chip survey participants for the years 2002 through 2005.
The opinions expressed herein are those of the author and do not necessarily represent the views of The Northern Trust Company. The Northern Trust Company does not warrant the accuracy or completeness of information contained herein, such information is subject to change and is not intended to influence your investment decisions.
© 2005-2022 http://www.MarketOracle.co.uk - The Market Oracle is a FREE Daily Financial Markets Analysis & Forecasting online publication.