


UK FTSE and Financial Markets Could be Hit by David Laws Resignation
Politics / UK Debt May 31, 2010 - 05:23 AM GMTBy: Nadeem_Walayat

 As if the brewing Korean Crisis and European Sovereign debt crisis were not enough, the weekend has seen the first internal crisis to hit the Con-Dem coalition government with the shock surprise resignation of David Laws, Chief Secretary to the Treasury after he was allegedly caught out fiddling his parliamentary expenses by funneling £40,000 to his gay lover in contravention of the expenses rules (Con-Dem Government Starts to Crumble, David Laws Resigns, Liberal Democrats Betray Voters).
Deficit Cutting Emergency
David Laws has the responsibility of implementing huge public sector spending cuts starting with the £6.2 billion announced last week and to culminate in at least another £20 billion of cuts to be announced in the emergency June 22nd budget as part of a multi-year programme. John Laws was seen as ideal for the job as a Liberal Conservative he fit perfectly well within the Con-Dem government and as a former investment banker was seen to have the requisite skills to perform the task at hand. However now he is gone, and his replacement Danny Alexander to be frank is clueless on the economy, and will probably be spending his Bank Holiday reading up on economics texts and Treasury official documents so that he can construct a speech that contains a few buzz words to give the illusion that he has some idea as to what he is doing.
The markets will not be forgiving for any indecision in terms of cutting the huge budget deficit that according to most recent data stands at £156 billion or about 11% of GDP, against which £6.2 billion of announced cuts is clearly too little with definitely more cuts to be announced to prevent the bond markets dump UK debt Spain style.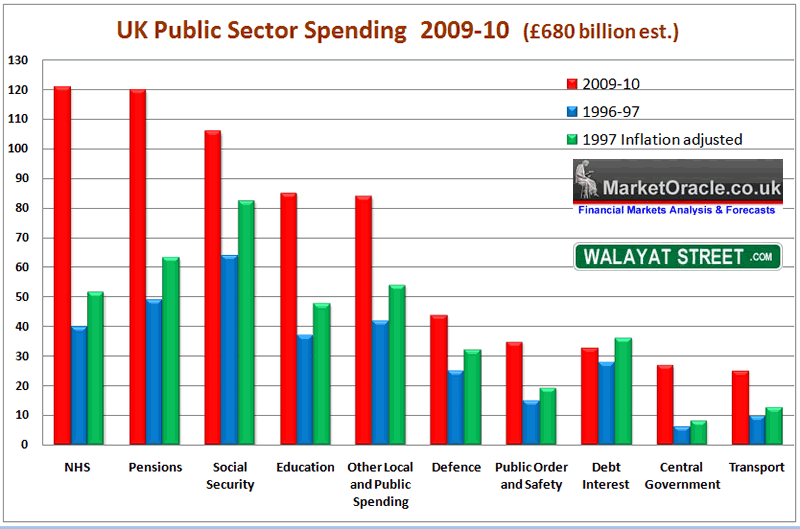
The above Government spending graph illustrates the amount Labour had plowed into the public sector annually over the past 13 years over and beyond inflation. For instance when Labour came to power government spending was at £318 billion which allowing for inflation would today stand at £408 billion. However Labour is spending an extra £270 billion over this as Labour continued to run a budget deficit even during the boom years which has today left the country with an annual budget hole of £156 billion. To say that the public sector had become bloated under Labour is an understatement as it is probably 25% larger than it should be i.e. government spending should be in the region of £508 billion instead of the current £677 billion. Out of control public spending by the Labour government is illustrated by Britains sacred cow, the NHS.
Con-Dem Crisis
The new governments crisis goes far beyond David Laws or Danny Alexander as now we face the question of how many more Lib Dem's who have never been under proper public scrutiny will be knocked out of the Con-Dem government as their dirty little secrets come out one by one. Already there are murmurings within hours that Danny Alexander has avoided paying capital gains tax by flipping the designation of his main home so as to claim expenses and not pay capital gains tax on profits. The same tax that is expected to more than double in the forthcoming emergency budget.
The whole affair greatly weakens the government that has yet to complete its 3rd week in office and could result in major market turmoil early this week, which means the FTSE could plunge by more than 100 points early Tuesday regardless of technical considerations and the usual inter-market influences from other stock exchanges.
Meanwhile the British Pound continues to undergo its corrective bounce after hitting a new 2010 low against the dollar of £/$1.42, presently trading at £1.4480. The correction is expected to revert towards the long-standing target for a decline to below £/$1.40 as illustrated by the below graph.
(26 Dec 2009 - British Pound GBP Forecast 2010 Targets Drop to Below £/$1.40)
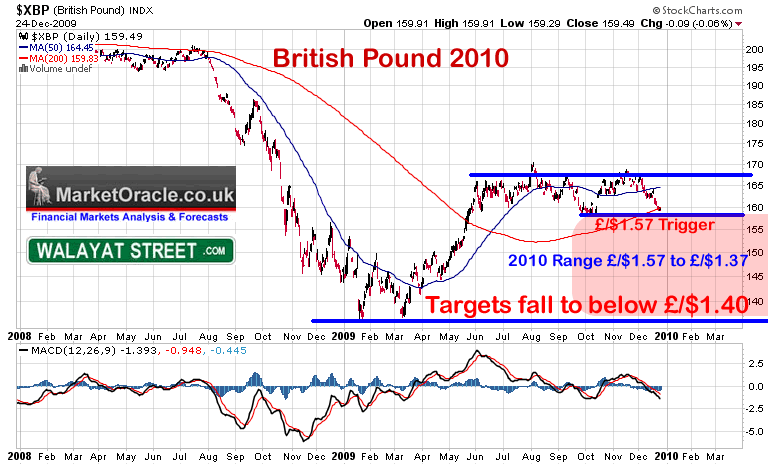
1. That sterling is targeting immediate support at £/$1.57 which implies it may temporarily bounce from there back through £/$1.60 before the eventual break.
2. That a break below £/$1.57 would target a trend to below £/$1.40. On a longer term view, the chart is indicative of trading range between £/$1.57 and £/$1.37, on anticipation of the eventual break of £/$1.57. On average this implies a 10% sterling deprecation against the trend of the preceding 6 months or so.
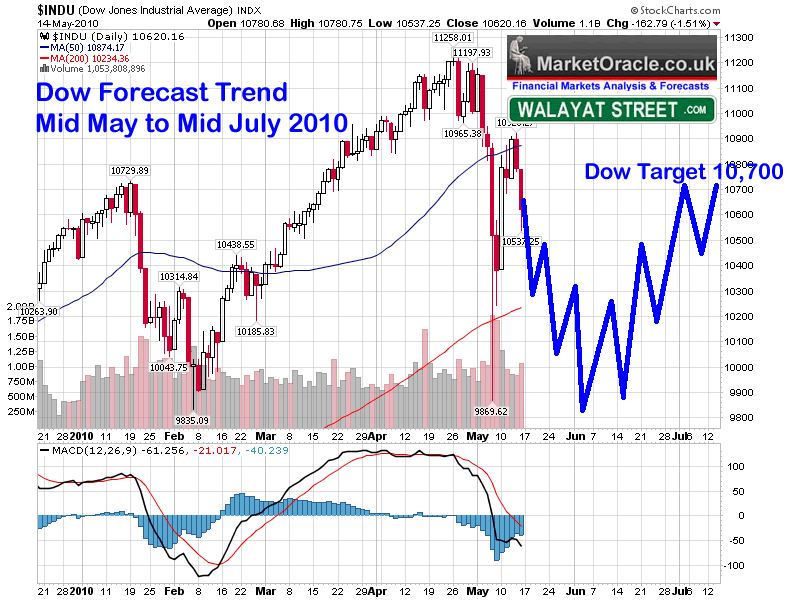
Ensure you are subscribed to my ALWASY FREE newsletter (only requirement an valid email address) to get both the in-depth analysis and weekly updates that I will send out later today in your email in box, including an update on the stock market correction underway as illustrated by the below graph.
(16 May 2010 - Stocks Bull Market Hits Eurozone Debt Crisis Brick Wall, Forecast Into July 2010)
Stock Market Conclusion
Despite the flash in the pan crash and prevailing Eurozone sovereign debt default gloom and doom, the bottom line is that this is still a stocks bull market with the Dow ONLY down less than 6% from its bull market peak. Therefore the sum of the above analysis concludes towards the stocks bull market under going its most significant and a highly volatile correction since its birth in March 2009 (15 Mar 2009 - Stealth Bull Market Follows Stocks Bear Market Bottom at Dow 6,470 ). This correction could last for several months and may extend all the way into early October, which suggests that the next 2 months are going to see an ABC correction to be followed by a sideways price action between the extremes of 10,900 to 9,800 and so despite continuing wild gyrations I would not be surprised if the Dow is little changed from its last closing price of 10,620 in 2 months time (16th July 2010). Expectations remain for the bull market to resume its trend towards a target of between 12k to 12.5k by late 2010 after the tumultuous trading period over the next few weeks. I have tried to illustrate a more precise Dow forecast projection in the below graph, reality will probably end up being far more volatile.
Source: http://www.marketoracle.co.uk/Article19922.html
By Nadeem Walayat
Copyright © 2005-10 Marketoracle.co.uk (Market Oracle Ltd). All rights reserved.
 Nadeem Walayat has over 20 years experience of trading derivatives, portfolio management and analysing the financial markets, including one of few who both anticipated and Beat the 1987 Crash. Nadeem's forward looking analysis specialises on UK inflation, economy, interest rates and the housing market and he is the author of the NEW Inflation Mega-Trend ebook that can be downloaded for Free. Nadeem is the Editor of The Market Oracle, a FREE Daily Financial Markets Analysis & Forecasting online publication. We present in-depth analysis from over 500 experienced analysts on a range of views of the probable direction of the financial markets. Thus enabling our readers to arrive at an informed opinion on future market direction. http://www.marketoracle.co.uk
Disclaimer: The above is a matter of opinion provided for general information purposes only and is not intended as investment advice. Information and analysis above are derived from sources and utilising methods believed to be reliable, but we cannot accept responsibility for any trading losses you may incur as a result of this analysis. Individuals should consult with their personal financial advisors before engaging in any trading activities.
Nadeem Walayat Archive |
© 2005-2022 http://www.MarketOracle.co.uk - The Market Oracle is a FREE Daily Financial Markets Analysis & Forecasting online publication.