FTSE 100 Index Forecast for Sept 2007 - Crash in the Financial Sector
Stock-Markets / UK Stock Market Sep 05, 2007 - 10:31 PM GMTBy: Nadeem_Walayat
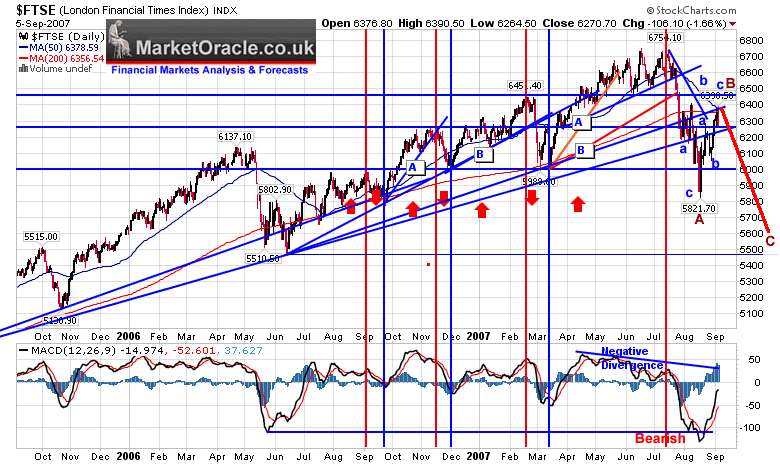
FTSE 100 rally from the recent lows appears to have ended and is signaling a third leg of the down trend that targets a new low for the year for the FTSE 100 Index. This is on the back of the continuing crash in the financial sector due to the ongoing Subprime sparked credit crunch.
Technical Analysis of the FTSE 100 Index

1. Trend Analysis - The Break below 6000 changed the dynamics of the anticipated summer correction into something far more severe. The current rally towards 6400 although strong is seen as being corrective and in advance of a third leg down. The question mark from a trend perspective is whether the 5821 level will hold for a double bottom or not. The recent break of 6000 has weakened the bull market. However, first things first, trend analysis targets a move back towards the 5821, a break of which would target a downtrend to 5500.
2. Time Analysis - The third leg down should be longer in duration than the first leg down, as the market would require more time to build a base, therefore signals a downtrend that is expected to continue into Mid October at least.
3. Elliott Wave Analysis - The previous elliott wave analysis of the FTSE implied a larger magnitude downtrend than originally anticipated, which is being confirmed by the unfolding price action. The chart shows a completed A wave to 5821 and the current rally as a B wave which confirms expectations of a third leg C wave lower, that is expected to break the A wave low, for an ABC pattern. The target for the decline is again 5500.
4. MACD Indicator - The MACD gave a very bearish signal with a break of the June 06 lows, which suggests at the least that the MACD will revisit the -100 area. The corrective up trend was from extreme oversold levels, which has taken the FTSE towards 6400. This has helped to work out the MACD's oversold state which means that FTSE 100 Index increasingly now looks vulnerable to continuing the downtrend towards 5821.
Summary - The FTSE 100 Index is expected to resume the downtrend towards a target of 5821. Depending on whether it breaks or not will determine the stock market trend for some time. At this point in time, probability marginally favors a break of 5821 and a trend towards 5500, therefore credit crunch bad news is far from over !
By Nadeem Walayat
(c) Marketoracle.co.uk 2005-07. All rights reserved.
The Market Oracle is a FREE Daily Financial Markets Forecasting & Analysis online publication. We present in-depth analysis from over 100 experienced analysts on a range of views of the probable direction of the financial markets. Thus enabling our readers to arrive at an informed opinion on future market direction. http://www.marketoracle.co.uk
Disclaimer: The above is a matter of opinion provided for general information purposes only and is not intended as investment advice. Information and analysis above are derived from sources and utilising methods believed to be reliable, but we cannot accept responsibility for any trading losses you may incur as a result of this analysis. Individuals should consult with their personal financial advisors before engaging in any trading activities.
Nadeem Walayat Archive |
© 2005-2022 http://www.MarketOracle.co.uk - The Market Oracle is a FREE Daily Financial Markets Analysis & Forecasting online publication.


