


Lower Interest Rates = Lower Stock Market - The Double Failure of the So-Called Fed Model
Stock-Markets / Stock Market Valuations Oct 03, 2007 - 12:19 AM GMTBy: Bob_Bronson

 Lower interest rates will lower, not raise, the stock market's P/E the stock market decline will accelerate as the fed lowers interest rates : Despite the popularity of the so-called two-factor Fed Model among institutional investors, we've explained why and how it is a faulty way to value the stock market. For example, Treasury-based interest rates (“interest rates”) lower than the earnings yield (inverse of the stock market's P/E ratio, or E/P) does not mean the stock market is undervalued, as is hyped by TV talking heads and reported by most all of the financial media. A third factor, risk aversion (investor mood), must be considered. (Past article)
But an even more important relationship between interest rates and the stock market must also be literally factored in the so-called Fed Model equation: their Supercycle Period-varying correlation.
First some conceptual background and terminology.
On October 10, 1997 we called for a Supercycle top, or the end of what we have quantified as the Supercycle Autumn, and the start of the current ultimately deflationary economic Supercycle Winter. Supercycle Autumn starts when the stock market acknowledges that goods and services price inflation (“inflation”) and interest rates have reached their Kondratieff Cycle (“K-Cycle”) peak. The Autumn disinflationary economic season ends when the stock market acknowledges that inflation and interest rates have declined back to their normal levels, or historical averages. See Exhibit H here .
During the ensuing Supercycle Winter – ongoing since our call – inflation and interest rates continue to decline from their normal, average levels down to their K-Cycle lows. We've pointed out that in contrast to their negative correlation during the disinflationary Autumn, when the stock market is over-performing its historical average and inflation/interest rates are declining, the correlation reverses to positive during the Winter, which ultimately turns out to be economically deflationary: stocks decline while inflation/interest rates continue their decline - below their historical average - down to their K-Cycle lows, which this time will most likely be 10-year T-bond yields below 3%, if not below 2%.
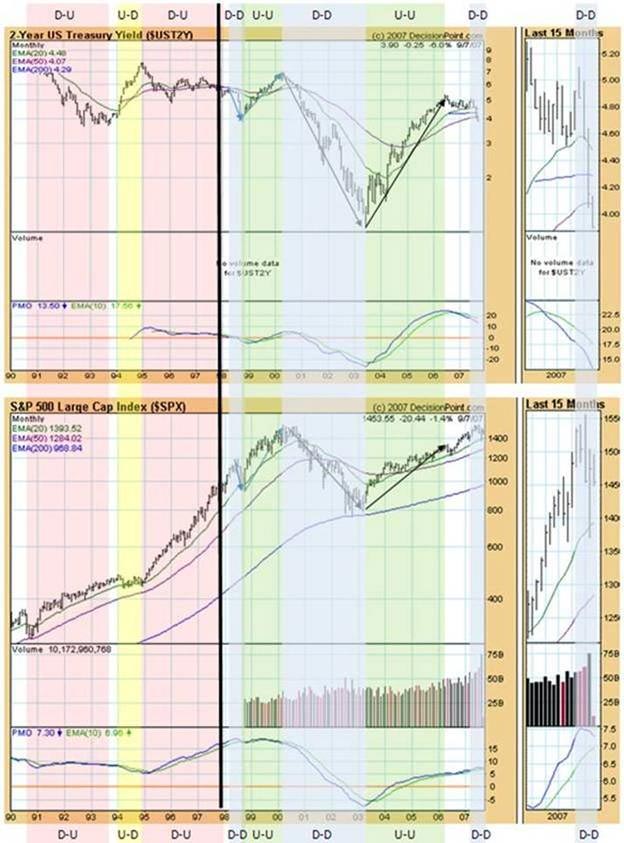
The following chart illustrates how the correlation reversed at the start of the Supercycle Winter when we made our Supercycle call -- the vertical black line. This is a chart of 2-year Treasury yields, which have the same correlation to the stock market as 10-year Treasury yields. Notice how the red down-up (D-U) areas and yellow up-down (U-D) areas dominated before our call (i.e. a negative correlation) but they reversed immediately afterwards (to a positive correlation), as indicated by the blue down-down (D-D) areas and green up-up (U-U) areas. We have used 2-year Treasury yields to demonstrate that the correlation applies to the short end of the yield curve as well as the long end.
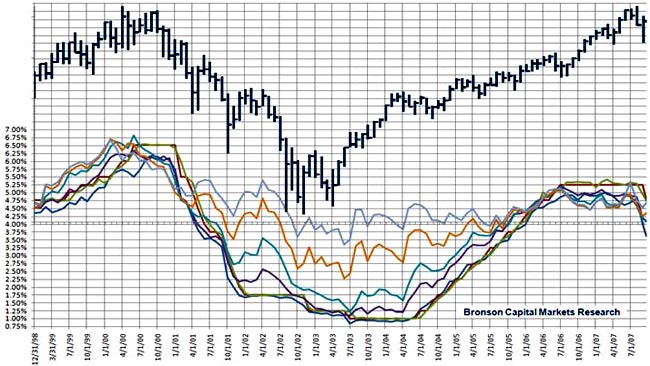
The following chart shows that during the Supercycle Winter the stock market is positively correlated – rises and falls contemporaneously -- with all interest rates. See the rates during the 2002-04 period of the 10-year T-bond, 5-year T-bond, 2-year T-note, 1-year T note, 90-day T-bill, and Federal fund (traded and target), which are shown here in descending order. They all topped out recently and are currently declining like they did in the second half of 2000.
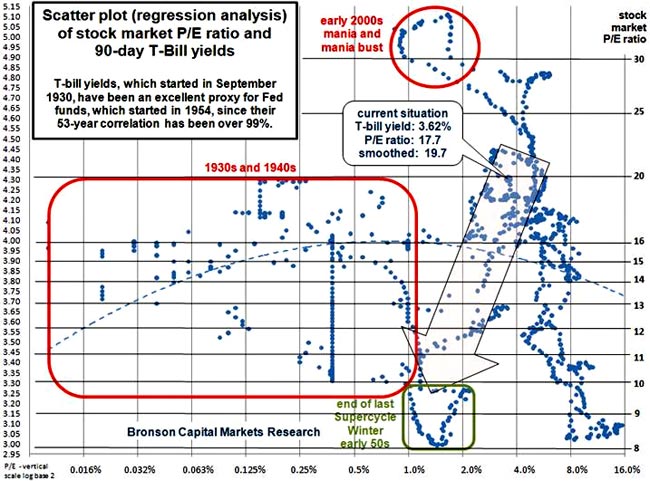
So the so-called Fed Model has predictably failed even more during the current Supercycle Winter, since the stock market's P/E continues to decline along with interest/inflation rates: past article The scatter chart (regression analysis) below shows the 77-year relationship between 90-day T-bill rates and the stock market P/E ratio, demonstrating why we expect them to go much lower, and simultaneously
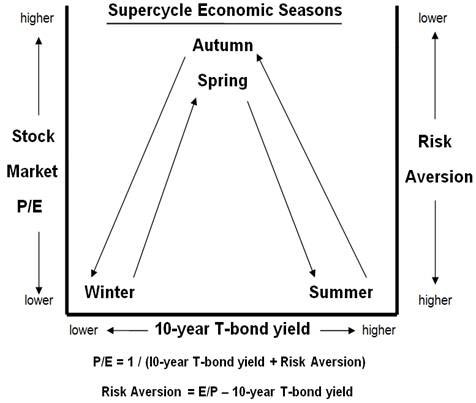
Supported by the above and previously presented data, the relationship of Supercycle seasons, inflation, interest rates (the inflation price of credit), P/E ratios and risk aversion are simplified in the following phase-state schematic:
The economic reasoning for the negative correlation should be clear by now. Investors bail out of stocks and pile into safe-haven Treasuries, as they will even more so in the second downleg of this Supercycle Bear Market, as we've warned, especially since the incipient recession will probably develop into a more severe recession than the last one. And the last one persisted for 29 months, despite the NBER claim it was only nine months - see past article .
We fully expect a double failure of the so-called Fed Model: 1) accelerating risk aversion, or negative investor mood (see the updated chart below) and 2) recession-induced declining interest rates with declining stock market P/E ratios and prices. We fully expect this will be progressively recognized by trend-following, bullishly-biased institutional investors (are there any other kind?) who will drive the second, about -50% downleg of the Supercycle Bear Market as we have forewarned, even if prematurely :
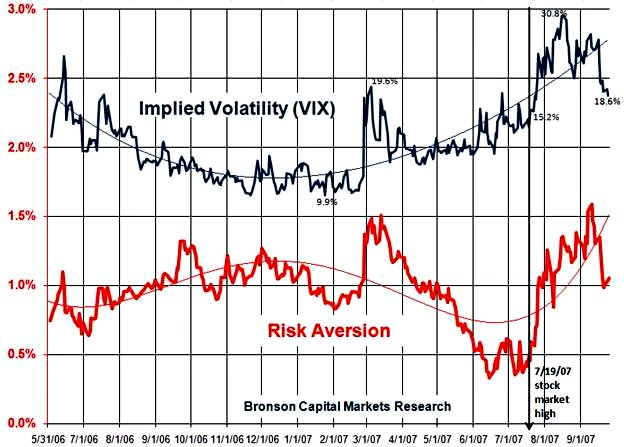
In the chart below, notice the recent months' positive correlation between VIX, the implied volatility index for the S&P 500 (upper dark blue line), and the risk aversion factor (lower red line).
We define the risk aversion factor as the arithmetic difference between the stock market's earning yield and long term interest rates, as measured by the 10-year T-bond yield. The stock market's earnings yield, or E/P, is simply the inverse of the stock market's P/E ratio. All of this is explained in more detail here :
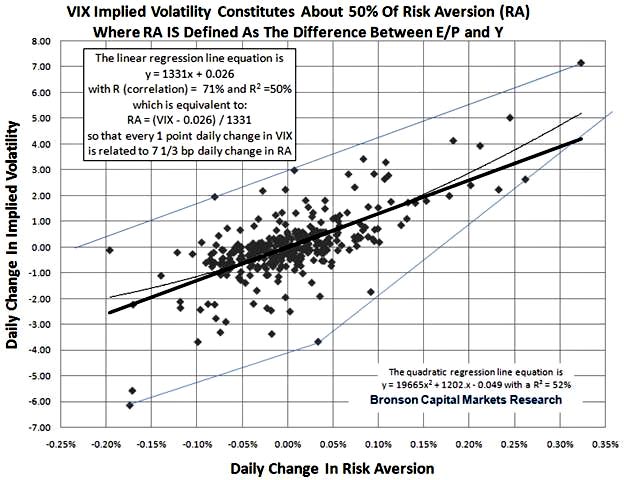
Long term, the correlation in their daily changes has been 71% (see chart below), with their r-squared ~ 50% (correlation squared). This suggests that volatility, on average, constitutes about 50% of investor's risk aversion, or the collective mood of investors, which cannot be explained by the relationship between corporate earnings and interest rates. The other 50% of the risk aversion factor is determined by investor mood other than stock market volatility. Note that volatility tends to lead, simply reflecting that option writers, whose put/call contracts incorporate implied volatility, act faster than the stock and bond investors who determine the earnings and bond yields, the other two components of the earnings capitalization formula explained in the link above.
The recent one-month stock market rally associated with the pullback in implied volatility (VIX) from 30.8% to 20.0% is primarily in response to investors' “irrationally complacent” hope that the credit squeeze has ended with the Fed lowering the discount rate 75 basis points and the Fed Funds target rate 50 basis points. (We note that the significant credit squeeze problem of the now-realized increased riskiness and illiquidity of extendable mortgage-backed commercial paper quality-rated as Tier 1 for money market mutual funds has not been resolved by the market or SEC.)
But notice that the risk aversion factor, which is all-important in valuing the stock market because it is four times more volatile than corporate earnings and 25% more volatile than interest rates, is in an uptrend that started even before the stock market's July 19 high. Currently, both of these bearishly-rising indicators have mean-reverted below their polynomial best-fit lines (thin curvilinear lines) about as much as they historically do, suggesting they have probably run their very short-term (days) bullish course.
As a measure of collective investor mood, the risk aversion factor is a composite, fundamental-technical indicator, since it reflects corporate earnings expectations, bond market activity, and stock market pricing and volatility.
Bottom line, notwithstanding the stock market's rally since its August 16 low that now appears to be ending, we continue to expect that the risk aversion factor will continue to escalate from its low around 0.3% to eventually about 7%, as the stock market's P/E ratio continues its seven-year decline to below 10 :
By Bob Bronson
Bronson Capital Markets Research
bob@bronsons.com
Copyright © 2007 Bob Bronson. All Rights Reserved
Bob Bronson 's 40-year career in the financial services industry has spanned investment research, portfolio management, financial planning, due diligence, syndication, and consulting. At age 23, he and his partner founded an investment research firm for institutional clients and were among the first to use mainframe computers for investment research, especially in the areas of alpha-beta analysis and risk-adjusted relative strength stock selection. Since 1967, he has served as an investment strategist and consultant to various investment advisory firms and is the principal of Bronson Capital Markets Research. If you wish to read more, read his BIO
A note to visitors ~ We do not have a website, but we maintain a private e-mail list. I'm also often asked why we provide research and forecast information for free. Since we are not looking for new business from the internet, I periodically post some of our research and forecasts in exchange for feedback from others. And since we don't publish in academic or industry trade journals, such internet discussion gives us as much peer review as we want and can conveniently assimilate at this time.
Also, the few archiving discussion boards in which I have the time to participate give us new ideas and allow us to establish and maintain intellectual property copyrights for our proprietary research, and to establish a verifiable forecasting record. At the same time, we are able to publicly document our forecasts and help others who otherwise don't have access to our work.
To be added to our private e-mail list, we only ask that you periodically provide feedback: questions, comments and/or constructive criticism to keep our research work and forecasts as error-free, readily comprehensible and topically relevant as possible. If you would like to be added, please explain, at least briefly, what you do, since our e-mailing list is categorized by the backgrounds of the recipients.
Robert E. Bronson, III Archive |
© 2005-2022 http://www.MarketOracle.co.uk - The Market Oracle is a FREE Daily Financial Markets Analysis & Forecasting online publication.