


Demystifying the S&P 1228 Target that Killed the Rally
Stock-Markets / Stock Markets 2010 Nov 13, 2010 - 07:29 AM GMT

If you were not looking for an important potential market top in the 20-week cycle, that was anticipated to be running long, on November 8, as the market closed in on the S&P 500 target of 1228, you must not be familiar with the Long Wave Dynamics approach to market analysis. The Long Wave Dynamics (LWD) approach recognizes that Fibonacci forces exert powerful but trackable forces on market cycles in both price and time.
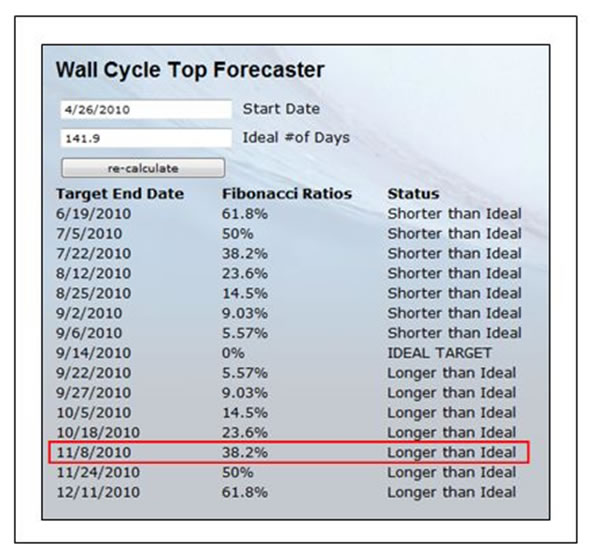
The 20-week cycle is clearly running long from aggressive monetary and fiscal policies. This is what the models day they will do. The November 8 target date was a 38.2% extension of the ideal length of a Wall cycle, as projected by the Wall cycle top forecaster tool on the LWD website. The S&P rallied hard into this target date, trading with about a point of 1228 on the trading days on either side of the target date.
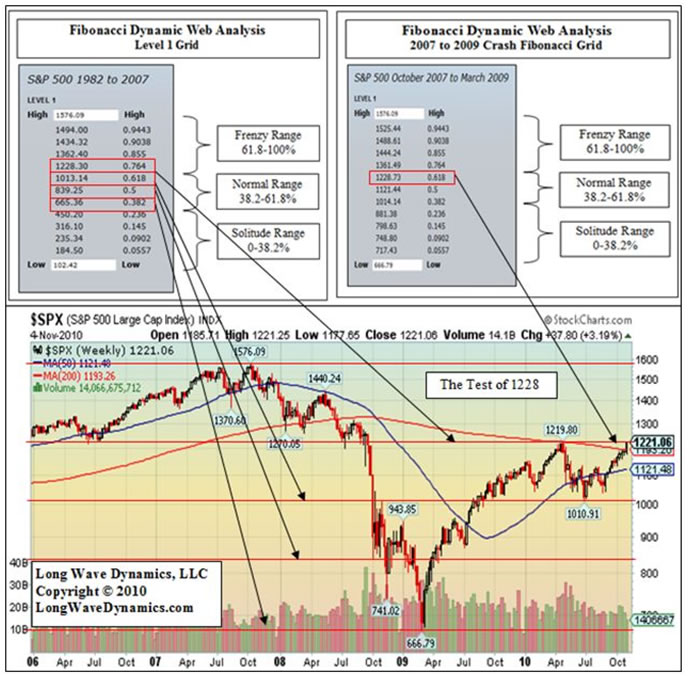
The 1228 target is the target that marks 76.4% (the inverse of the 23.6% Fibonacci ratio) of the 1982-2007 move in the S&P on an intraday basis. It also happens to be the golden ratio 61.8% target of the entire intraday 2007-2009 crash. That makes 1228 an important target that was guaranteed to produce powerful resistance. In fact, it is unequivocally the most important target since the intraday low on March 6, 2009.
If your palms weren’t sweating as the market approached November 8 and the 1228 price target, like a close championship game in the final seconds of play, then you simply weren’t paying attention to the most powerful market signals available. The S&P has been falling like a rock every since the buzzer went off at the 1228 target in price and time.
Below are the Level 1 Fibonacci price grids of the S&P 500 for the entire 1982-2007 move and the 2007-2009 crash. Also included is a 5-year weekly chart of the S&P 500 that should make you truly wonder at the forces at work in the universe, and in the human action that produces financial market activity.
Market cycles always show the courtesy of leaving a crumb trail on a stock chart, which are essentially the printouts of fields of human activity in global markets. The LWD method studies fields “cycles” of human action in global markets, and identifies key market turn targets in price and time. Investors are more interested in the larger cycles and traders focus on the smaller cycles. The smaller cycles are just miniature versions of the larger cycles. Scientists call these fractals, at LWD call them cycles, and we call them as we read them on the stock charts with Fibonacci tools in price and time. We provide subscribers with access to the same Fibonacci tools we used to produce the monthly LWD Letter and the LWD Weekly Update blog.
The Wall cycle top forecaster, that forecast a top from the prior Wall cycle top on April 26, 2010, and the Level 1 Fibonacci price grid should have had you glued to the market action around 1228 around the November 8 target. However, these big Level 1 targets only roll around every so often, like the bounce off the Level 1 target of 1013 on July 1, 2010. When you combine the cycle top and bottom forecasters, the Fibonacci price grids from Level 1 on down, with the Fibonacci Dynamic Web approach to understanding a Fibonacci grid, you will step into a whole new dimension of the human action impact on global markets in price and time.
Drilling down to the Level 2 and Level 3 grids in any market will uncover important intraday turning points in the market. The market will regularly make a turn right down to 1/100th of a point at the 61.8%, 38.2% targets in the Level 2, Level 3 and even Level 4 grids. The method is a traders dream. When a subscriber recently asked for Level 4 Fibonacci grids with four digits to the right of the decimal in the euro index, I knew they were having way too much fun tracking human action in currency markets around the globe.
I recently demonstrated for subscribers using the Fibonacci Dynamic Web price grid methods that gold is trading in a “hot” Level 1 Fibonacci grid with a top target close to $2,300 way per ounce. When you drill down into Level 2 and Level 3 of that grid, you find that gold is trading with precision intraday around key targets produced by the Level 3 Fibonacci price grids using a Level 1 price that is still way out in the future. LWD methods will change your view of the potential of market forecasting forever.
From a fundamental perspective, and at LWD we also love the fundamentals, the dividends on the S&P 500 are paltry. Anyone telling you this market is cheap is likely selling you an investment product. And one other observation that is relevant, the market is likely starting to wonder about the QE2 pump when the U.S. bumps up against the debt ceiling next spring. The freshman class in the House of Representatives is not just going to raise the debt ceiling without a fight. Think long and hard on that one. If Chairman Bernanke starts buying municipal and sewer bonds when U.S. Treasuries go off limits due to the failure of the debt ceiling extension, I’ll bet the Honorable Ron Paul may have a few questions for him up on the Hill.
Investors and traders need to keep an eye on the Wall and Quarter Wall cycle top and bottom cycle forecasters, in conjunction with the Fibonacci price grids, to identify upcoming turns. The QE2 rocket fuel being poured on the market could allow the market to make one more charge at 1228 into the November 24 target date.
For investors it will be much safer to wait for the current oversized Wall cycle puts in a bottom. The market may make another charge at new high into 2011. There may be a chance to pick up a few large caps with global franchises that are growing with the emerging markets and sporting a descent yield for a low risk run in the next Wall cycle. However, the oxygen is getting thin, and even grade-schoolers know that more debt does not cure a debt problem.
If you think the LWD approach only works for stocks, think again. The Fibonacci grids in bonds, currencies and gold will rock your world. The LWD approach allows you to identify intraday market turning point targets in price and time in virtually any market in the world. One subscriber recently described it succinctly this way after watching the market turn on an exact target, “It’s not fair, to those that are not subscribers to The Long Wave Dynamics Letter.”
David Knox Barker is a long wave analyst, technical market analyst, world-systems analyst and author of Jubilee on Wall Street; An Optimistic Look at the Global Financial Crash, Updated and Expanded Edition (2009). He is the founder of LongWaveDynamics.com, and the publisher and editor of The Long Wave Dynamics Letter and the LWD Weekly Update Blog. Barker has studied and researched the Kondratieff long wave “Jubilee” cycle for over 25 years. He is one of the world’s foremost experts on the economic long wave. Barker was also founder and CEO for ten years from 1997 to 2007 of a successful life sciences research and marketing services company, serving a majority of the top 20 global life science companies. Barker holds a bachelor’s degree in finance and a master’s degree in political science. He enjoys reading, running and discussing big ideas with family and friends.
© 2010 Copyright David Knox Barker - All Rights Reserved Disclaimer: The above is a matter of opinion provided for general information purposes only and is not intended as investment advice. Information and analysis above are derived from sources and utilising methods believed to be reliable, but we cannot accept responsibility for any losses you may incur as a result of this analysis. Individuals should consult with their personal financial advisors.
© 2005-2022 http://www.MarketOracle.co.uk - The Market Oracle is a FREE Daily Financial Markets Analysis & Forecasting online publication.