


Stock Market Weekly Update: Rumor Has It
Stock-Markets / US Stock Markets Oct 27, 2007 - 03:43 PM GMTBy: Dominick
 Don't get the idea from reading this update that performing real time Elliott wave analysis is easy, or that consistently selling tops and buying bottoms is something you can learn how to do overnight. It's not, and if that's the rumor you've been hearing, it's as wrong as this week's emergency Fed meeting. But do understand that making money by finding favorable risk/reward entries and exits is exactly what we do at TTC, week in and week out, through our rigor and vigilance and determination. And, what's more, if you're willing to be patient and pay attention, we can teach you to do the same!
Remember, this is the update that said on October 6 it was time to start looking for an intermediate top, which we got in a big way a few days later, and just said last week it was time to start thinking most of the selling was done. Kind of speaks for itself, doesn't it?
Well, to be fair, we weren't so certain what we'd see as we started out on Monday, but over the course of the week we discovered, as you will by reading this update, not to expect new highs or new lows, but just to trade in a range ahead of the Fed. So, what we came to find was a daytrader's paradise with huge intraday swings that favored the unbiased trader willing to take bullish and bearish positions as the opportunity arose. Of course, it didn't hurt that we had the right numbers, the invisible lines, to guide our thinking.
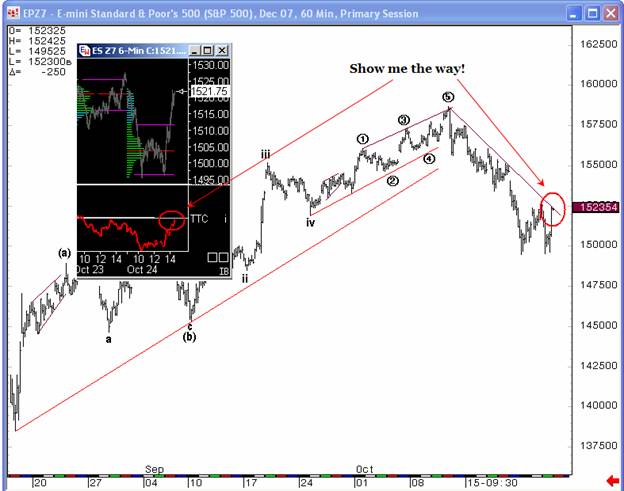
For this week, the hits began with the gap down Monday morning right into a big support number of ours at 1506. We're talking futures, of course, but this number roughly corresponded with 1500 in the S&P cash index. As we said last week, we expected the market would grow legs out of this hole and, though the market continued through our immediate target, the bounce back above 1506, with demonstration of support at that level, had us long from at least there while most others were still looking for the big Hail Mary short. To tip our hand a little bit, the following chart from last weekend is partly what had members expecting at least a bounce early in the week.
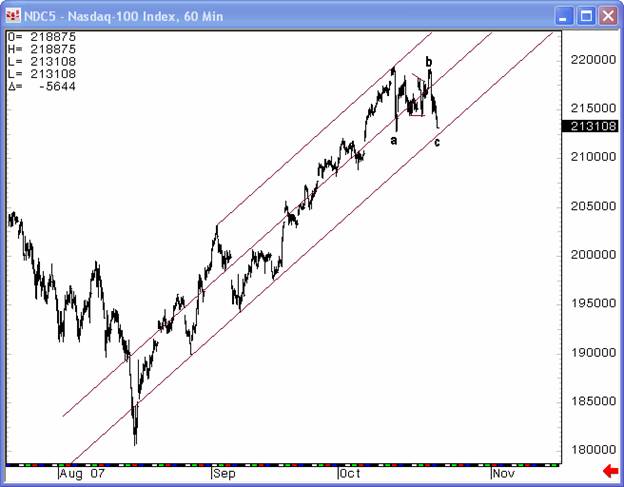
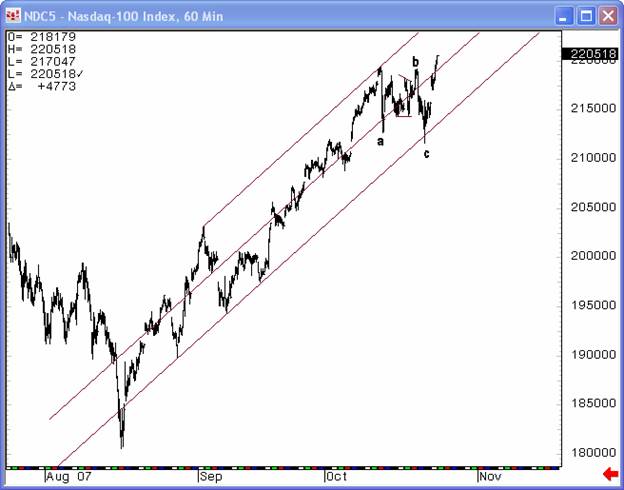
Once long, our target in the S&P futures for Monday of 1518 missed by only 2 points, resulting in 10 points of profit. The rally continued so that by the end of Tuesday, the Nasdaq chart looked like this:
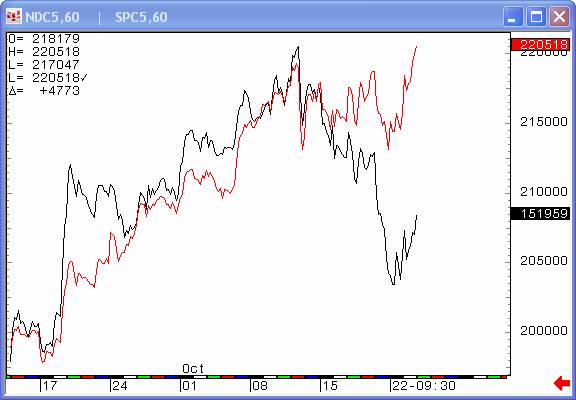
Not bad for the longs, eh? But that was just the beginning. Tuesday afternoon, we recognized the spread between the S&P and the Nasdaq as shown in the chart immediately below, reflecting the narrowness of the rally and hinting at possible topping action, if not an all-out crash.
Wednesday's gap down and continued selling justified the chart below.
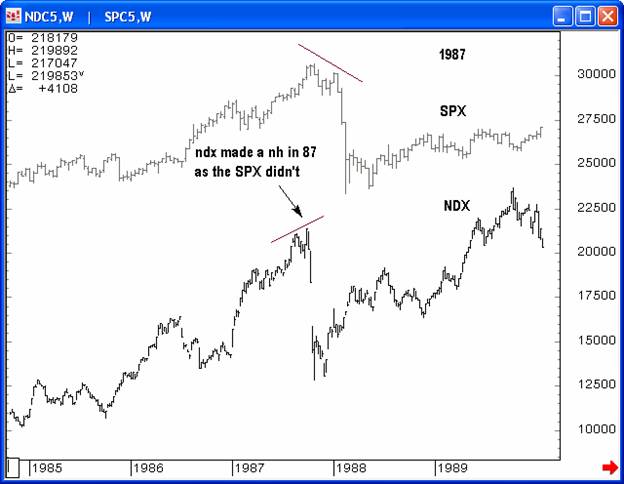
Again we looked to our number at 1506 for support, but when it gave way only to see the next target at the 1495 double bottom looking to hold, we began to suspect the crash expectations were overdone. As we rallied back to 1506 and demonstrated support there to the exact tick, we had all we needed to confirm the market was respecting our numbers and that we could abandon the 1987 scenario in favor of further upside. The rally continued strong right into the close, but as it converged on obvious resistance, a call to TMAR (take the money and run) rang out in the form of the following chart:
After an impressive opening, Thursday's selloff exceeded immediate expectations, but allowed the testing of one of our proprietary indicators. As Thursday's decline provided the selling pressure we were expecting, we were called to do a bit of what we're best at, that is, rolling, or real time, analysis. Thursday's decline gained momentum, but we got a surprising reading from one of our proprietary indicators, as it was diverging from the decline in price. Despite a concern from members that after two years this indicator was finally leading us astray, I posted to the forum that it was enough to keep me from shorting.
As it played out, we got another precise bounce off of 1506 and that was enough to have even the most bearish members finally put the 1987 analog to rest as we'd wanted to do since last weekend, and get long a market that was not ready for an all-out crash. Only later did we discover the news was crediting the rally to a rumor about an emergency Fed meeting and possible rate cut, absolutely ridiculous when you think about it. Once again, the excuse sounds credible, but we had the move based on charts alone without the news. Go figure.
Still, as I said at the start of this update, real time analysis is not easy. In hindsight, after we hear from the Fed, it'll be easy to count this week's action, but in real time you sometimes need extra resources to stack the odds in your favor. At TTC, those “extras”, as you've seen, are our proprietary target numbers and proprietary indicators, like the one just mentioned.
Friday was another day that probably had Elliotticians pulling their hair as TTC members played it cool. The chart below shows how the S&P played with our numbers, valuable targets for scalpers. Letting go of specific wave counts and instead playing our proprietary resources provides extra value for our membership.
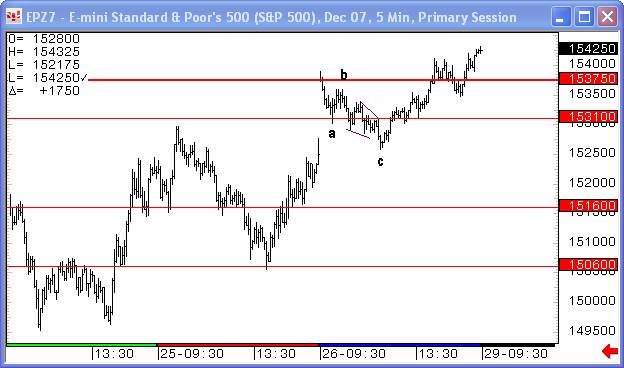
The gap up on Friday's open was the second of the week to come in right at one of our key levels, always enough to suggest profit taking for anyone holding a position from the previous day. This time it was 1537.50, a number broadcast to members all week as the most crucial for understanding the larger trend in the market. Though the market put most traders to sleep Friday afternoon selling lower from our 37.5 target, it made a powerful statement by closing decisively above this level. Going into next week and the impending Fed meeting our position relative to this point will be crucial to determining our outlook.
Whereas the Fed was virtually guaranteed to cut 50 basis points after last week's dismal close, this week's advances call that assumption into question. The bottom line is all traders should be playing conservatively next week, and avoid trying to guess the Fed's decision. Instead, let's try to gauge the Street and its expectations. If we're given any reason to rally on Halloween, you can pretty much expect our previous highs to be taken out. From there, just when least expected, we could be ripe for an impressive selloff. If, on the other hand, the Street is disappointed, whatever that might mean from the Fed, there's not much below us to prevent a significant decline, though probably not the end of the world, especially if we've rallied into the decision.
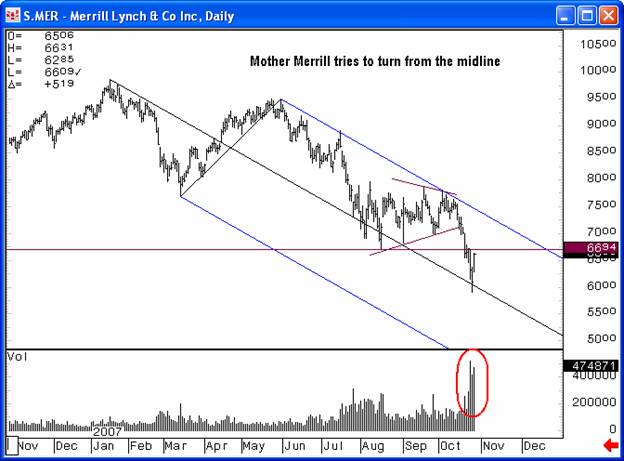
One stock to watch in the meantime is probably Merrill Lynch (MER), who bounced from a channel midline on Friday. If the tech stocks need to take a break, but the bank index gets a bounce from either change in the management or the Fed, that will be more than enough to get new highs out of the S&P. Either way, it appears Mother Merrill has bottomed or will soon.
Make no mistake folks, we're about to enter a powerful and important week of trading. All I can say is that, when the bell rings and the trading starts, I'm glad I have charts, targets and indicators to give me an advantage and not just CNBC and a handful of rumors on the floor. If this is the sort of edge you're looking for in your trading, now is a great time to join TTC.
Don't forget to Join now for only $89 a month!
Have a profitable and safe week trading, and remember:
“Unbiased Elliott Wave works!”
By Dominick
www.tradingthecharts.com
If you've enjoyed this article, signup for Market Updates , our monthly newsletter, and, for more immediate analysis and market reaction, view my work and the charts exchanged between our seasoned traders in TradingtheCharts forum . Continued success has inspired expansion of the “open access to non subscribers” forums, and our Market Advisory members and I have agreed to post our work in these forums periodically. Explore services from Wall Street's best, including Jim Curry, Tim Ords, Glen Neely, Richard Rhodes, Andre Gratian, Bob Carver, Eric Hadik, Chartsedge, Elliott today, Stock Barometer, Harry Boxer, Mike Paulenoff and others. Try them all, subscribe to the ones that suit your style, and accelerate your trading profits! These forums are on the top of the homepage at Trading the Charts. Market analysts are always welcome to contribute to the Forum or newsletter. Email me @ Dominick@tradingthecharts.com if you have any interest.
This update is provided as general information and is not an investment recommendation. TTC accepts no liability whatsoever for any losses resulting from action taken based on the contents of its charts, commentaries, or price data. Securities and commodities markets involve inherent risk and not all positions are suitable for each individual. Check with your licensed financial advisor or broker prior to taking any action.
Dominick Archive |
© 2005-2022 http://www.MarketOracle.co.uk - The Market Oracle is a FREE Daily Financial Markets Analysis & Forecasting online publication.