


A look at the short-term inflationary trends in Gold and Oil stocks
Stock-Markets / Forecasts & Technical Analysis Jan 27, 2007 - 07:15 PM GMTBy: Clif_Droke

In the commentary of early January, I made a case for the oil and gas stocks finding support above their 200-day moving averages and making a technical rally based on a number of momentum signals, particularly in the Amex Natural Gas Index (XNG). That forecast has since materialized and we have the beginnings of a rally in the natural resources sector. The question now becomes one of how much more upside potential remains for the leading natural resource stocks; that question we'll take up in this commentary.
Donald Rowe of the Wall Street Digest points out, “ Historically, numerous corporations try to raise prices during the month of January in order to improve margins. Consequently, prices tend to rise-- even spike up--in January. However, many of these January price increases are rolled back in February or March when they meet resistance from customers or when market share declines. Consequently, inflation is always a problem every January.”
With that in mind, and in view of the recent rally in the 10-year Treasury Yield Index (TNX), let's focus our attention on the inflation-sensitive stock market segments in view of the spike in seasonal/short-term inflationary pressure. This belief isn't based solely on the observation that inflationary spikes are common in the winter, but rather, but is based mainly on the recent rate of change (momentum) reversals in our proprietary HILMO indicators for the oil, gas and precious metals mining stocks.
The AMEX Gold Bugs Index (HUI) rose 0.47% on Friday to end the week at 332.53. The XAU index was 0.15% higher on Friday to end the session at 138.65. The price of spot gold closed at $644.60 for the week while spot silver closed the week at $13.26.
In reviewing the gold/silver stock sector each day we look at overbought/oversold indications based on price and volume oscillators. We also look at moving averages and support/resistance as well as seasonal/cyclical influences. But by far the most important aspect of my technical work in analyzing the gold stocks is internal momentum, namely the GS HILMO (hi-lo momentum) indicators. These are based on a measure of how many stocks are making net 10-week highs within the sector. GS HILMO shows the rate of change, or put another way, allows us to anticipate shifts in momentum on a short-term and intermediate-term basis.
In the time I've worked with the HILMO series of momentum indicators across many different stock market sectors (not just the golds/silver stocks) I've learned to distill the essence of the momentum signals into three basic camps:
- The 5/10/20-day HILMO indicators are primarily immediate-term signals.
- The 30-day HILMO indicator is probably the dominant short-term momentum indicator.
- The 60-day HILMO indicator is most likely the dominant short-to-intermediate-term trend reflection.
- The 90-day HILMO indicator is the sub-dominant interim bias indicator and perhaps the most important for gauging strength or weakness within the sector.
- The 120-day HILMO indicator is the dominant interim bias indicator; it's very important but for judging the near term, it's superseded by 90-day HILMO.
The following chart shows what the current configuration for the gold stock sector's internal momentum gauges look like. The lines below show the GS HILMO indicators on a 5-day, 20-day and 90-day rate of change basis. Currently all three are in a rising trend and 5-day momentum has already entered into positive territory. The 20-day, as well as the 30-day, momentum indicators should enter positive territory within the next week or so, and 90-day momentum entered positive territory on Friday.
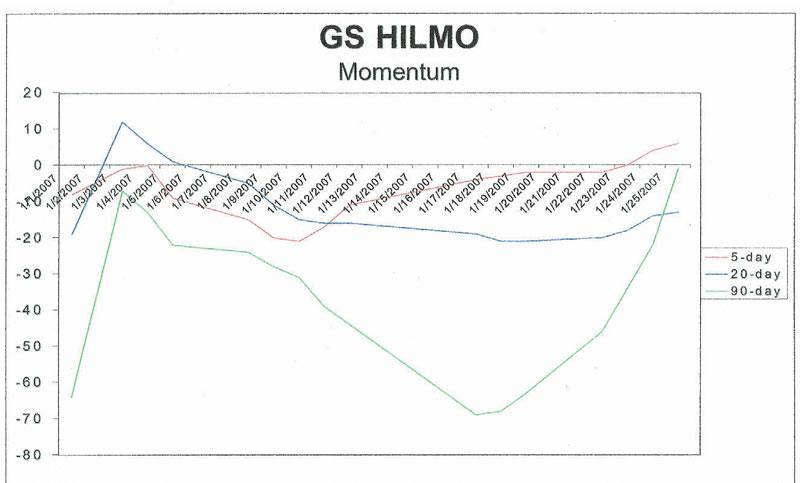
Meanwhile, 60-day gold stock momentum (not shown) is neutral with a slight downward bias, but nothing serious. The lack of strong upward bias in the gold stock internal momentum isn't a cause for concern in the short term, although a rising 60-day GS HILMO indicator would only help prices to rise more strongly and evenly.
The only fly in the ointment right now (isn't there always one?) is 120-day HILMO, which is current in a declining trend and about to enter negative territory. The acceleration of the rate of change on the downside should slow down to a crawl in the coming days, and while 120-day momentum isn't expected to reverse high until March, the fact that it's currently down won't necessarily rain on the gold stock group's parade in the near term. The effect it will likely have is to keep the gold stocks from reaching their full potential. The best analogy I can offer up is that the flagging 120-day HILMO is akin to an Olympic class sprinter trying to run the 100 meters with a parachute tied to his back. He can still run and make some headway, but he isn't going to win any races with that parachute creating a wind drag against him.
The key consideration here, in my view, is the 90-day HILMO indicator. It's currently in the process of exploding upward as you can see in the chart above. Based on rate of change calculations the explosive move higher in 90-day HILMO should continue well into February before petering out. I expect the extraordinary rising trend in 90-day HILMO to not only create an environment of strong underlying support for the actively traded gold/silver stocks in the next few weeks but those stocks showing relative strength and external momentum should be able to work higher. For simplicity's sake, the easiest definition of “external momentum” I can provide are those stocks above their rising 200-day and 400-day moving averages, as well as the stocks above their 30/60/90-day moving averages.
What I expect from the gold stock sector in the overall scheme of things in the coming month is, first of all, volatility. There isn't any easy way of getting around it since 60-day and 120-day internal momentum is going against the golds while the other momentum indicators are up. I expect the XAU to try and eat its way through the nearby overhead resistance between 140-150 in a very grunting, halting fashion. However, with 90-day momentum being up so strongly I'd say the odds favor the XAU eventually testing the December high at around 150. In the Amex Gold Bugs Index (HUI) this would equate to a test of the 360 area.
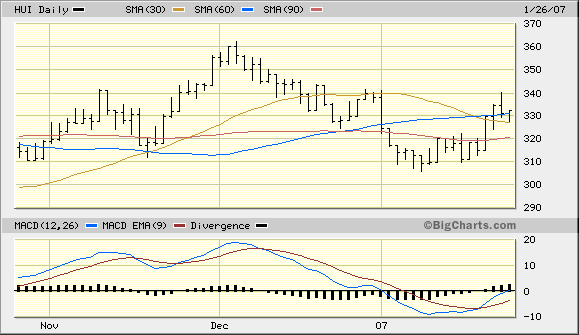
Unfortunately, I'd also have to say the odds do not favor the XAU testing its high from May of last year at 170, at least not in the foreseeable future. Again, this consideration is based on the downward bias of the dominant interim momentum indicator of 120 days. Until this indicator turns up again it will most likely limit the upside potential of the gold stock index.
Turning our attention to the oil and gas equities, the Amex Oil Index (XOI) recently closed at 1,142 and right above its 90-day moving average. XOI is trying to re-establish support above its recent low near the 1,100 level and I believe it will succeed in doing so based on internal momentum factors. As with the gold stocks, the oil stocks show an improving 90-day momentum indicator (OILMO) and this, plus the anticipated reversal in 20-day OILMO, should allow the leading oil stocks a near term technical rally.
By Clif Droke
www.clifdroke.com
Clif Droke is editor of the 3-times weekly Momentum Strategies Report which covers U.S. equities and forecasts individual stocks, short- and intermediate-term, using unique proprietary analytical methods and securities lending analysis. He is also the author of numerous books, including most recently "Turnaround Trading & Investing." For more information visit www.clifdroke.com
© 2005-2022 http://www.MarketOracle.co.uk - The Market Oracle is a FREE Daily Financial Markets Analysis & Forecasting online publication.