


Key Levels to Watch in Stocks, Dollar, and Commodities
Stock-Markets / Financial Markets 2011 May 09, 2011 - 08:39 AM GMTBy: Chris_Ciovacco

 If you follow the markets closely, it is easy to produce a back-of-the-envelope bull/bear analysis given the mixed bag of fundamentals and technicals. On the bullish side of the equation:
- Global economic expansion intact
- Healthy corporate profits
- Accommodative monetary policy
- Bullish inverse head-and-shoulders patterns
On the bearish side of the equation:
- Slowing economic growth
- End of QE2
- Stubbornly high unemployment
- Global debt problems
- Strength in defensive sectors
The May 6 stock market trading session produced a candlestick indicative of indecision or hesitation between the bulls and bears. Often hesitation like this is followed by a change in the short-term trend. Currently, the very short-term trend is down. Given the uncertain outlook, anything to help us better understand probable outcomes is of value. The May 6 session gave us three S&P 500 levels to help monitor the bull/bear tug-of-war (see below).
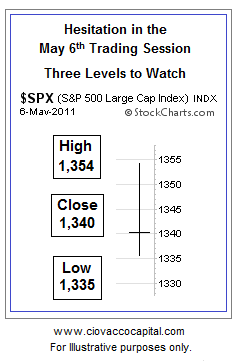
The high from May 6 now represents short-term resistance. A break above, and more importantly a close above the May 6 high of 1,354 would give the bulls an advantage for the remainder of the week. The move above 1,354 would be more meaningful if it is accompanied by above average trading volume and/or positive market breadth (advancers vs. decliners).
Given the uncertain state of affairs, we may respond to a bullish move (close above 1,354) by using some cash to buy a broad market vehicle, such as RSP (Rydex Equal Weight S&P), DIA (Dow Diamonds), or SPY (S&P 500 Index).
The low from May 6 now represents short-term support. A break below, and more importantly a close below the May 6 low of 1,335 would give the bears an advantage for the remainder of the week. The move below 1,335 would be more meaningful if it is accompanied by above average trading volume and/or negative market breadth (advancers vs. decliners). While not as important as the low of 1,335, the May 6 close of 1,340 also represents a form of short-term support - a close below it is bearish short-term.
Bearish outcomes (close below 1,335) would have us consider taking another incremental step away from risk. Depending on how the week unfolds, we would consider cutting back on energy (XLE) and commodities (DBC, SLV).
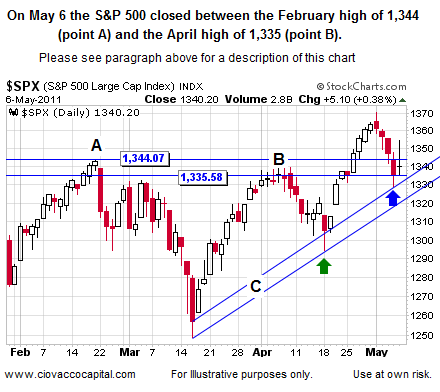
In the chart above, point C highlights the short-term trendline which remains in play and may act as support for stock prices. The market held at the green arrow and is trying to make a stand near the blue arrow.
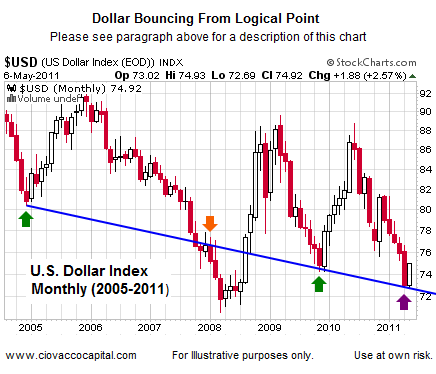
The currency markets can also help us monitor the health of the current advance in stocks and commodities. Typically, during periods of risk aversion, the U.S. dollar (UUP) takes on a 'safe haven' status. While it is too early to read too much into the May 6 move in the greenback, it is noteworthy, and potentially bearish for stocks and commodities, that the dollar found buyers at a logical level dating back to 2005 (see below). The green arrows show where the blue trendline acted as support in 2005 and 2009. The same trendline acted as resistance in late 2007 (orange arrow). The purple arrow shows the U.S. dollar as of May 6.
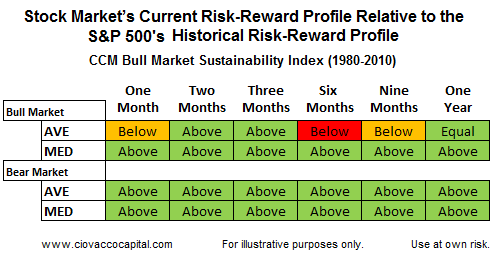
From a historical risk-reward perspective, the CCM Bull Market Sustainability Index (BMSI) still tells us (a) we remain firmly in a bull market, and (b) the odds continue to favor higher highs in stocks.
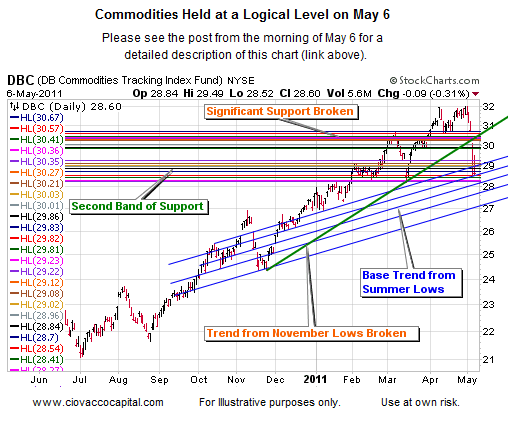
We described the meaning of the chart below on the morning of May 6. The version below is as of the close on May 6. It tells us that commodities held at a logical level, which gives hope to the bulls that the bleeding may stop soon. A strong bounce early this week would make the chart below more significant.
By Chris Ciovacco
Ciovacco Capital Management
Copyright (C) 2011 Ciovacco Capital Management, LLC All Rights Reserved.
Chris Ciovacco is the Chief Investment Officer for Ciovacco Capital Management, LLC. More on the web at www.ciovaccocapital.com
Ciovacco Capital Management, LLC is an independent money management firm based in Atlanta, Georgia. As a registered investment advisor, CCM helps individual investors, large & small; achieve improved investment results via independent research and globally diversified investment portfolios. Since we are a fee-based firm, our only objective is to help you protect and grow your assets. Our long-term, theme-oriented, buy-and-hold approach allows for portfolio rebalancing from time to time to adjust to new opportunities or changing market conditions. When looking at money managers in Atlanta, take a hard look at CCM.
All material presented herein is believed to be reliable but we cannot attest to its accuracy. Investment recommendations may change and readers are urged to check with their investment counselors and tax advisors before making any investment decisions. Opinions expressed in these reports may change without prior notice. This memorandum is based on information available to the public. No representation is made that it is accurate or complete. This memorandum is not an offer to buy or sell or a solicitation of an offer to buy or sell the securities mentioned. The investments discussed or recommended in this report may be unsuitable for investors depending on their specific investment objectives and financial position. Past performance is not necessarily a guide to future performance. The price or value of the investments to which this report relates, either directly or indirectly, may fall or rise against the interest of investors. All prices and yields contained in this report are subject to change without notice. This information is based on hypothetical assumptions and is intended for illustrative purposes only. THERE ARE NO WARRANTIES, EXPRESSED OR IMPLIED, AS TO ACCURACY, COMPLETENESS, OR RESULTS OBTAINED FROM ANY INFORMATION CONTAINED IN THIS ARTICLE. PAST PERFORMANCE DOES NOT GUARANTEE FUTURE RESULTS.
Chris Ciovacco Archive |
© 2005-2022 http://www.MarketOracle.co.uk - The Market Oracle is a FREE Daily Financial Markets Analysis & Forecasting online publication.