


Gold Rally Momentum Deteriorating
Commodities / Gold and Silver 2011 Jun 19, 2011 - 06:07 PM GMTBy: Merv_Burak

 Either speculators are getting used to the daily Middle East and EU (primarily Greece) upheavals or have taken tranquilizers as the gold trading in recent days has not been all that energetic. The momentum of the recent move is deteriorating and that implies that gold might just take another dip. How far and how long is anyone’s guess.
GOLD
LONG TERM
Although the momentum of the gold trading action has subsided considerably still all the technical indicators that I follow remain in their positive zones and trends. Gold remains well above its positive sloping long term moving average line. The long term momentum indicator, although not all that exuberant, is still comfortably inside its positive zone. It is, however, very slightly below its negative sloping trigger line. That could change with just another up day in the market. As for the volume indicator, it remains the most positive of indicators and has entered new all time high territory. It remains above its positive sloping trigger line. Putting those indicators together the long term rating remains BULLISH.
INTERMEDIATE TERM
Over the past few months gold has reacted downwards a few times and each time it touched, or just about touched, its positive sloping intermediate term moving average line and turned around back to the up side. That may be what it is doing once more. One difference this time versus the previous times is that this time the reaction towards the moving average line did not start from a new high in the price of gold. One would almost envision a deterioration in speculator’s interest in gold and do not seem willing, enthusiastically, to push the price of gold higher, at least not at this time. Still, the indicators remain positive and one takes their directions from the prevailing trend (with one eye open to any warnings). Gold remains above its positive sloping intermediate term moving average line while the intermediate term momentum indicator remains in its positive zone. One small sign of warning is the fact that the momentum indicator was below its trigger line for a few days and although it did move above the trigger on Friday the trigger line itself remains in a downward slope. The volume indicator continues on its upward path and above its intermediate term positive sloping trigger line. For now the intermediate term rating remains BULLISH with the short term moving average confirming by remaining above the intermediate term average.
HEAD AND SHOULDER PATTERN (H&S)
Technician’s sometimes grasp at straws trying to see patterns in the charts they follow. Let’s grasp at one straw here. Do you see that head and shoulder pattern (H&S)? I have my own criteria for when I determine a H&S pattern, and I emphasize that this is my own criteria and not found in any texts that I know off. For a H&S pattern to be valid it must be based upon a bullish up trend. I have seen some analysts claim H&S patterns that developed from a bear trend, but not here. The basic criteria that I look for is that the distance from the start of the
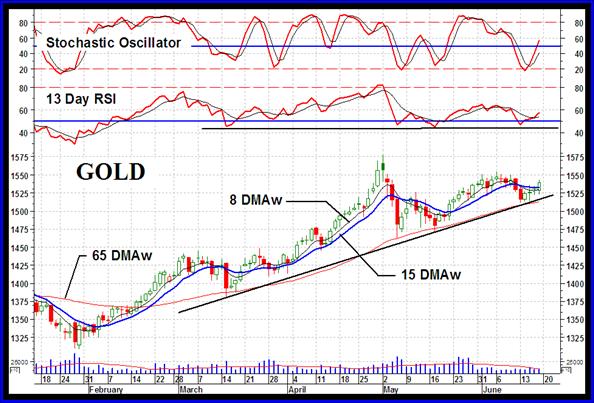
bull trend to the top of the head must be AT LEAST twice the distance as from the top of the head straight down to the neckline. Now, most of the time the neckline is horizontal or very close to it. Here, we have a very steep upward sloping neckline and one might be very leery to call this a H&S pattern BUT it does meet my basic criteria so what the heck, let’s go for it and call this a H&S pattern. I do look for one more indicator to give me the confidence that the H&S pattern is valid. I look for the momentum indicator to give me a negative divergence at the head. Unfortunately, we do not have that validation here. The momentum indicator is just slightly higher at the head location versus its left shoulder. That does not mean that the pattern is not valid but it does make it a little less likely to be completed by a break below the neckline. However, we do have a very strong support level for the momentum and a break below this support (at around the 45% mark) would provide a confirmation of a trend reversal. We should know very soon as the price of gold is not that much above the neckline and could break below any day, or move sharply higher.
Oh yes, there is one more indicator that many text books look at to determine a H&S pattern, that is the volume action. Most like to see lower volume action at the head versus at the left shoulder and like to see the volume pick up after the break on the right. I have found volume action to be too often a misleading indicator. It’s great when it increases SHARPLY on a break or at critical points but is often misleading when it decreases. So I look at volume only for a confirmation once the pattern has been broken to give me more confidence of the validity of the break, if the volume increases sharply. Still, go with the trend. If you are wrong the trend will quickly tell you that by reversing.
A final point, a H&S pattern is only a valid H&S pattern AFTER a right shoulder neckline break. Anytime before that (such as the present) it is only a POTENTIAL H&S.
SHORT TERM
Short term the market has been going up and down but very recently the up side has shown signs of exhaustion. We seem to be once more in one of those upward moves. Gold has just moved above its short term moving average line and the line has just turned to the up side. The short term momentum indicator has bounced back into the positive zone after only one day in the negative. It has also crossed above its trigger line with the trigger finally turning upward. On a daily basis the volume activity remains relatively mild and still below its 15 day average. Once more the short term rating has turned towards the BULLISH side. However, the very short term moving average line, although turned to the up side, has not yet crossed above the short term line for confirmation of this bull.
As for the immediate direction of least resistance, I’ll go with the up side as that is the direction of the latest action and the Stochastic Oscillator is in an aggressive upward slope.
SILVER
As the Table of Technical Information and Ratings suggests, Silver is still strong versus the other precious metal Indices but gold has taken over the top performance spot for the short and intermediate term. The recent weakness in silver is starting to show in the ratings and performance. Silver is still number 1 from the long term perspective, but for how long?
The recent month long rally in silver has been even more subdued than that of gold. The long term rating for silver remains BULLISH with silver above its positive long term moving average line and the long term momentum remaining in its positive zone.
The intermediate term has weakened considerably over the past month or more. Silver remains below its negative sloping moving average line and the intermediate term momentum indicator remains in its negative zone although just very slightly in the negative. The intermediate term rating remains BEARISH at this time but could change with only a couple of positive days of action. The short term moving average line confirms this bear.
On the short term silver is bouncing up and down similar to gold. At the present time silver remains just below its short term negative sloping moving average line while the momentum indicator remains in its negative zone but just slightly above its negative sloping trigger line. Still, the short term rating remains BEARISH with the very short term moving average line confirming.
PRECIOUS METAL STOCKS
It now looks like all of the major North American Gold and Silver Indices as well as the Merv’s Indices have broken below their recent support levels and continue to head towards lower levels. In addition, the long term momentum indicators for the Major North American Indices have also moved into their negative zones while the Merv’s Indices momentum indicators are still mixed, some now negative while others still positive. This may differ slightly from the Table information as the Table information is based upon slightly different indicators than used for my normal analysis and may be a little slower to turn around.
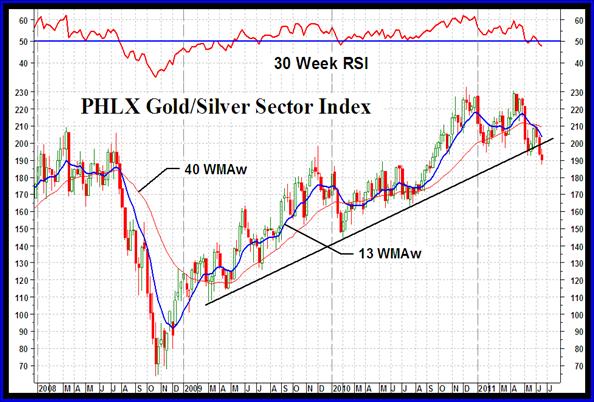
The PHLX Gold/Silver Sector Index is typical of the major North American Indices. Next week I expect to show my Merv’s Gold & Silver 160 Index for comparison. The 160 Index shows the average performance of the 160 component stocks, including the top 100 stocks by market value.
The Merv’s Spec-Silver Index was the only Index showing a positive move over the past week. Looking over the component stock list this positive performance was not the result of a single super performance but did result from several component stocks with double digit performances. Possibly the speculative silver stocks have been so battered over the past few weeks that “bottom fishers” just all jumped in at the same time hoping to catch the bottom. That’s a long shot gamble. Nothing wrong with such strategy as long as one understands it is a long shot gamble. If you keep trying to pick the bottom as the stock declines, sooner or later you will pick the bottom. Whether you can profit from such pick will, of course, depend upon you having any capital left by that time.
The Merv’s Penny Arcade Index moved lower with the rest of the Indices but at a slower pace. Maybe its decline is coming to an end and better results may not be far ahead.
Merv’s Precious Metals Indices Table
Well, that’s it for this week. Comments are always welcome and should be addressed to mervburak@gmail.com.
By Merv Burak, CMT
Hudson Aero/Systems Inc.
Technical Information Group
for Merv's Precious Metals Central
For DAILY Uranium stock commentary and WEEKLY Uranium market update check out my new Technically Uranium with Merv blog at http://techuranium.blogspot.com .
During the day Merv practices his engineering profession as a Consulting Aerospace Engineer. Once the sun goes down and night descends upon the earth Merv dons his other hat as a Chartered Market Technician ( CMT ) and tries to decipher what's going on in the securities markets. As an underground surveyor in the gold mines of Canada 's Northwest Territories in his youth, Merv has a soft spot for the gold industry and has developed several Gold Indices reflecting different aspects of the industry. As a basically lazy individual Merv's driving focus is to KEEP IT SIMPLE .
To find out more about Merv's various Gold Indices and component stocks, please visit http://preciousmetalscentral.com . There you will find samples of the Indices and their component stocks plus other publications of interest to gold investors.
Before you invest, Always check your market timing with a Qualified Professional Market Technician
Merv Burak Archive |
© 2005-2022 http://www.MarketOracle.co.uk - The Market Oracle is a FREE Daily Financial Markets Analysis & Forecasting online publication.