


Stock Market Fiscal Pop-N-Drop Warning
Stock-Markets / Stock Markets 2013 Jan 02, 2013 - 10:40 AM GMTBy: Chris_Vermeulen

 Today’s gap higher in stocks has many investors feeling really good about but will this rally last?
My to the point answer is “Yes” but there will be some bumps and navigating positions along the way.
Looking at the charts below you will notice how stocks are trading up over 4% in two trading sessions and several indicators and technical resistance levels are now being tested. Naturally when several resistance levels across multiple time frames, cycles and indicators we must be open to the idea that stocks could pause or pullback for a few days before continuing higher.
Here is a quick snapshot of charts I follow closely to help determine short term overbought and oversold market conditions.
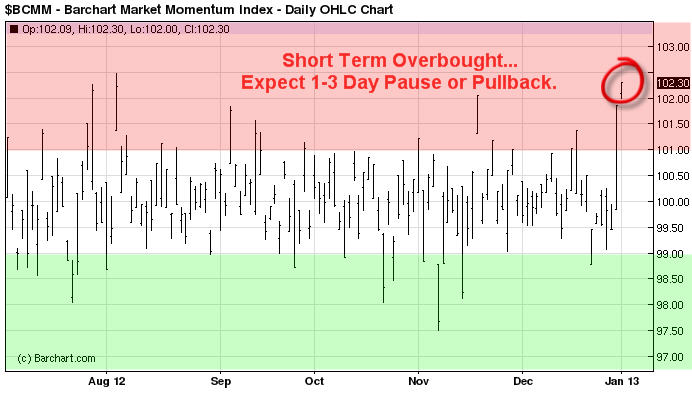
Momentum Extremes:
This chart helps me know when stocks are overbought or oversold. This trend can be follows using the 30 or 60 minute charts helping you spot short term tops and bottoms.
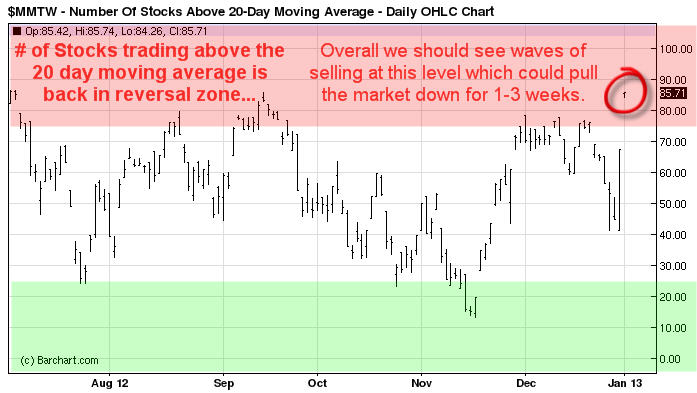
Stocks Trading Above 20 Day Moving Average:
This chart helps me time swing trades which last for 1-3 weeks in length and I use the daily chart to spot these reversals and trends.
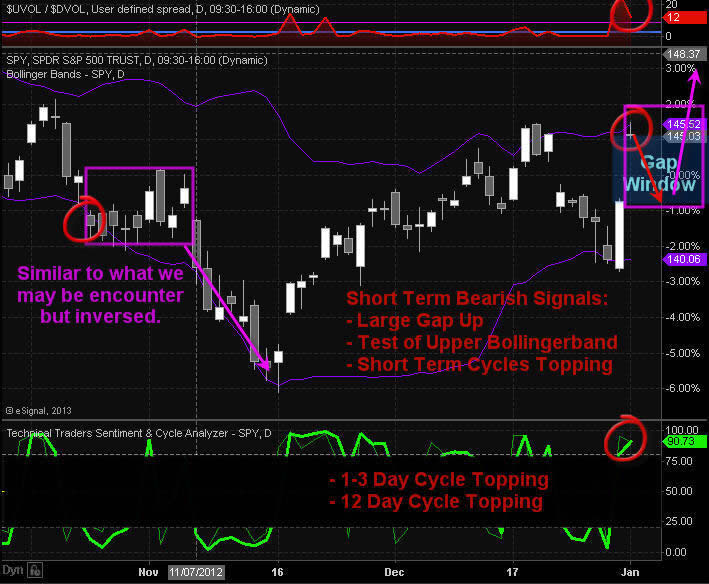
Daily SP500 Index Chart:
This chart shows the big gap in price, test of upper bollingerband, momentum and swing trading cycles topping and 12 buyers to ever one seller on the NYSE which tells me everyone is running to buy everything they can today and that is a contrarian signal.
Trading Conclusion:
This strong bounce which started on Monday from a very oversold market condition does look as though it has some power behind it. And over the next 1-3 days we could see prices grind higher until this momentum stalls out. Once that happens we should see most of the gap filled. This will provide us with a lower entry price and reduce our downside risk for index, sector and commodity ETFs.
If you are a stock trader then be sure to checkout my partners stock trading website www.ActiveTradingPartners.com where his last two trades Dec 31 pocketed 12.3% with gold stocks ETF NUGT, and took more profits with PRLB Jan 2nd for a 9.2% gain.
This type of bounce and momentum can lead to a running correction which makes it impossible for traders to by on a dip. A running correction is when prices slow chop higher in a narrow range for some time then explode higher continuing its rally. This is when you just need to jump in trades and chase prices higher but we will not do that until I see signs of a running correction.
Today many of the major market moving stocks are testing resistance which means if they start to get sold the broad market will pullback with them.
Follow All My Trades for 2013 – Start Today: http://www.thegoldandoilguy.com
By Chris Vermeulen
Please visit my website for more information. http://www.TheGoldAndOilGuy.com
Chris Vermeulen is Founder of the popular trading site TheGoldAndOilGuy.com. There he shares his highly successful, low-risk trading method. For 7 years Chris has been a leader in teaching others to skillfully trade in gold, oil, and silver in both bull and bear markets. Subscribers to his service depend on Chris' uniquely consistent investment opportunities that carry exceptionally low risk and high return.
This article is intended solely for information purposes. The opinions are those of the author only. Please conduct further research and consult your financial advisor before making any investment/trading decision. No responsibility can be accepted for losses that may result as a consequence of trading on the basis of this analysis.
Chris Vermeulen Archive |
© 2005-2022 http://www.MarketOracle.co.uk - The Market Oracle is a FREE Daily Financial Markets Analysis & Forecasting online publication.