


Who Profits From the Fed?
Politics / US Federal Reserve Bank Mar 07, 2013 - 06:38 PM GMTBy: David_Howden

 We recently looked at the Federal Reserve’s 2012 results. In particular, we pointed to some positive and negative developments. On a positive note, the Fed managed to shrink down the size of its balance sheet by approximately one-third of a percent. (Hey, it’s a start.) On a negative note, this decrease occurred because banks shifted their holdings of reserves into cash, thus forcing the Fed to sell off some of its assets. I explained that this is a potentially negative result, as the shift into cash brings with it inflationary pressure on prices.
In this article I want to point out who has benefited from the Fed’s operations over the past year.
There has been a lot of discussion about the large increase in reserves, and especially excess reserves, held by the banking system. Mostly this discussion is couched in terms of the increase in the money supply. While the increase in excess reserves—less than $2bn in August 2008 to almost $1.5 trillion at the end of 2012—does represent an increase in the money supply, some rule changes accompanying the crisis also signify that they are part of a bailout. One aspect of the Fed’s crisis response was to commence paying interest on required and excess reserve balances. (The required reserve is the amount of money banks must hold to meet the minimum reserve requirement on deposits, and excess reserves are any amount held in excess of this minimum.)
Interest on reserves is set at 0.25 percent, and is paid from the Fed’s operating revenues to its member banks. As we can see in Figure 1 below, the Fed has paid the banking system nearly $4bn each year for the last two years to hold on to their reserves.
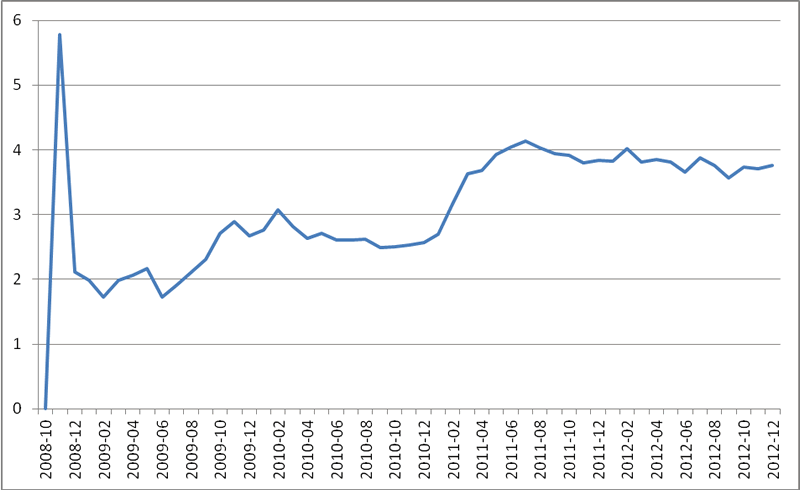
Figure 1: Interest paid on reserve balances (annualized, $bn) Source: Federal Reserve Bank of St. Louis
One way to think of this payment is as a sort of bailout. Since the payments on reserves are paid out from the Fed’s operating revenues, it reduces its end of year profits by the same amount. Since these profits would normally be remitted to the Treasury, the policy of paying interest on reserves has been, in effect, a fiscal policy involving a transfer from the Treasury to the banking sector. Interest on reserves redirects taxpayer money to the banking system, over $4bn during 2012. This transfer from the Fed to the banking system is larger than any single year transfer from the Fed to the Treasury prior to 2009.
The Fed estimates that it will remit to the Treasury $88.9bn from its 2012 operations, a record-breaking year. As we can see in Figure 2, there has been a steady increase in the amounts of remittances to the Treasury over the past decade, and especially since 2009.
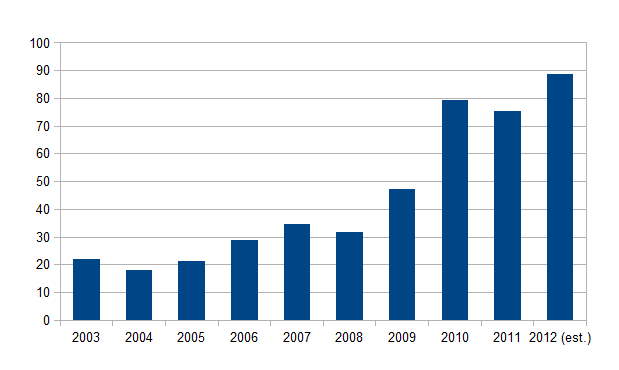
Figure 2: Federal Reserve annual remittances to U.S. Treasury ($bn)
The sharp increase after 2008 was the result of the quantitative easing policies. By increasing the money supply, the Fed had to purchase assets from the banking system. Some of these assets were U.S. Treasuries, some were riskier mortgage-backed securities, and some were guaranteed Federal agency debt. All of these newly purchased assets paid an interest rate, which contributed to the increase in Fed operating revenues and profits as it increased the money supply.
The $91bn of net income came almost wholly from interest earned on the securities the Fed holds ($80.5bn).
The U.S. Treasury issues bonds which are bought by the Federal Reserve. (We should note that the Fed doesn’t buy these bonds directly from the Treasury, but only on the secondary market from favored dealers.) Interest paid on these bonds accumulates at the Fed as income, and at the end of the year the Fed distributes it back to the Treasury, less its operating expenses. Since the Fed held, give or take, about $1.6 trillion of U.S. Treasury securities over 2012, the government was essentially able to get a free lunch—any interest paid on these securities was an accounting fiction, as it was remitted back at the end of the year (less expenses).
Normally the Fed only operates at the short end of the yield curve. This means that as a general rule the Fed only purchases short-term U.S. Treasury debt. Since short-term debt is also the lowest yielding, some might say that the Fed is not really providing much of a free lunch.
The big news during 2012 for Fed watchers was the expansion of its “Operation Twist.” With an increased focus on the long end of the yield curve, the Fed started purchasing bonds of longer maturity to keep long-term borrowing costs low. This was a savvy move that would help shield the Treasury from the effects of some of the Fed’s own policies. The Fed has the potential to increase inflationary pressures on prices through its monetary expansion. Since this inflation is not occurring now, but almost certainly will at some future date, only longer-dated securities will see their yields rise to account for their lost purchasing power. This would spell disaster for a Treasury that finances itself in part with longer-dated securities. By pledging to buy longer-term bonds, the Fed will artificially reduce their yields and thus mask the inflation premium building on their yields.
| Jan. 1, 2012 | Jan. 1, 2013 | Change | |
| Within 15 days | 17,847 | 0 | -17,847 |
| 16 to 90 days | 25,506 | 5 | -25,501 |
| 91 days to 1 year | 87,285 | 16 | -87,269 |
| 1 to 5 years | 650,378 | 378,474 | -271,904 |
| 5 to 10 years | 660,486 | 862,403 | 201,917 |
While the Fed has slightly decreased the total amount of Treasuries held, Operation Twist has increased the average maturity of these holdings. The Fed currently holds almost no Treasuries with maturities under 1 year and has increased its holdings dated longer than 5 years by over $200bn. Even though the total amount of Treasury debt held has decreased, the total distribution to the Treasury has increased because of this maturity shift. By holding higher interest rate bonds of longer maturities, the Fed earns more interest, which results in more profit to remit to the Treasury at year end.
As we review the Fed’s operations in 2012 we see the usual outcomes. The banking sector has benefited from its operations (unusually so, thanks to the continued interest on reserve policy) and the government has received a free lunch by having a ready buyer for its ever-increasing debt, especially long-term debt, which might otherwise be susceptible to inflationary pressures increasing its interest yield. Let’s see what surprises the Fed has in store for us in 2013.
David Howden is a PhD candidate at the Universidad Rey Juan Carlos, in Madrid, and winner of the Mises Institute's Douglas E. French Prize. Send him mail. See his article archives. Comment on the blog.![]()
© 2011 Copyright Ludwig von Mises - All Rights Reserved Disclaimer: The above is a matter of opinion provided for general information purposes only and is not intended as investment advice. Information and analysis above are derived from sources and utilising methods believed to be reliable, but we cannot accept responsibility for any losses you may incur as a result of this analysis. Individuals should consult with their personal financial advisors.
© 2005-2022 http://www.MarketOracle.co.uk - The Market Oracle is a FREE Daily Financial Markets Analysis & Forecasting online publication.