


Stock Market Valuation and Reversion to the Mean
Stock-Markets / Stock Market Valuations Apr 12, 2008 - 12:46 AM GMTBy: John_Mauldin

 Market Cycle Math
 - Where Are We Today?
- Analyze and Strategize
Are we in a bull, a bear, or a cowardly lion market? As we will see, the answer can make a huge difference in your investment portfolio. This week I am at my Strategic Investment conference in La Jolla. About four times a year I take a break from writing the letter and bring in a guest writer. This week Thoughts from the Frontline will have the very distinguished analyst and author Vitaliy Katsenelson.
 In his recent book, Active Value Investing: Making Money in Range-Bound Markets (Wiley, 2007), he exhorted investors to fasten their seat belts and lower expectations for the next decade or so. He also provided a strategy for improving returns in this environment, what he calls range-bound or cowardly lion markets. Long-time readers will recognize some themes consistent with my own research, but Vitaliy adds some very interesting twists that I believe will make you think. In today's letter, Vitaliy runs through his analysis of what will happen and provides an overview of how investors can make money in what will otherwise be an ocean of stagnant returns. Warning: the letter will print long, but that is because there are a lot of great charts.
Let me also highly recommend Vitaliy's book, Active Value Investing. I think as you read today's letter, you will get a sense of why I am so enthusiastic about his work. You can get you copy at Amazon.com .
Bull, Bear, and Cowardly Lion Markets
By Vitaliy Katsenelson
For the next dozen years or so the US broad stock markets will be a wild roller-coaster ride. The Dow Jones Industrial Average and the S&P 500 index will go up and down (and in the process will set all-time highs and multiyear lows), stagnate, and trade in a tight range. At some point during the ride, index investors and buy and hold stock collectors will realize that their portfolios aren't showing much of a return.
I know this prediction has a mild sci-fi feel to it. After all, how could I possibly know what the market will do, especially that far into the future? Though I'll explain in more detail in just a second why I have the audacity to make this prediction, let me offer you a little factoid: over the last 200 years, every full-blown, long-lasting (secular) bull market (and we just had a supersized one from 1982 to 2000) was followed by a range-bound market that lasted about 15 years. Yes, this happened every time, with the exception of the Great Depression, over the last two centuries.
Though we tend to think about market cycles in binary terms - bull (rising) or bear (declining) - in the long run markets spend a lot more time in bull or range-bound (sideways) states, roughly half in each, and visit a bear cage a lot less often then we think. This distinction between bear and range-bound markets is extremely important, as you'd invest very differently in one versus the other.
Are bull markets driven by superfast economic growth? Are range-bound markets caused by subpar economic growth? Could the subpar market performance be related to high or low inflation?
The answer to all these questions is undoubtedly - "no." Though it is hard to observe in the everyday noise of the stock market, in the long run stock prices are driven by two factors: earnings growth (or decline) and/or price-to-earnings expansion (or contraction).
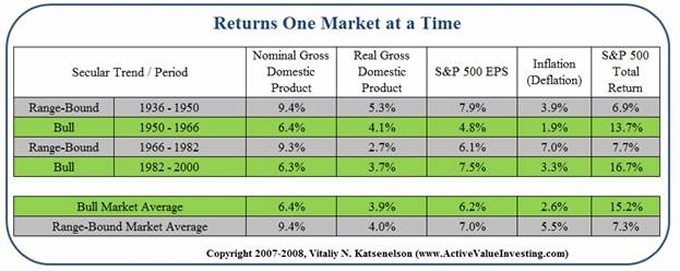
As is apparent from Exhibits 1 & 2, either by a decade at a time or a market cycle at a time, it is difficult to find a link between stock performance and the economy (e.g., GDP, corporate earnings growth, or inflation). The connection does exist, but periods of disconnect appear to last for decades at a time.
Exhibit 1
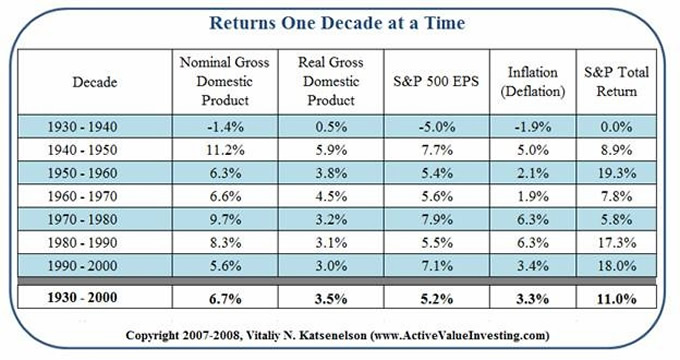
Exhibit 2
What about interest rates? Exhibit 3 shows P/Es for the S&P 500 (based on one-year trailing earnings) and inverse long-term bond yields - the implied P/E - the famous Fed Model. This model, despite its name, is NOT endorsed by the Fed; it indicates the existence of a tight relationship between (inverse of) long-term Treasury bonds and P/Es of the S&P 500.
Exhibit 3
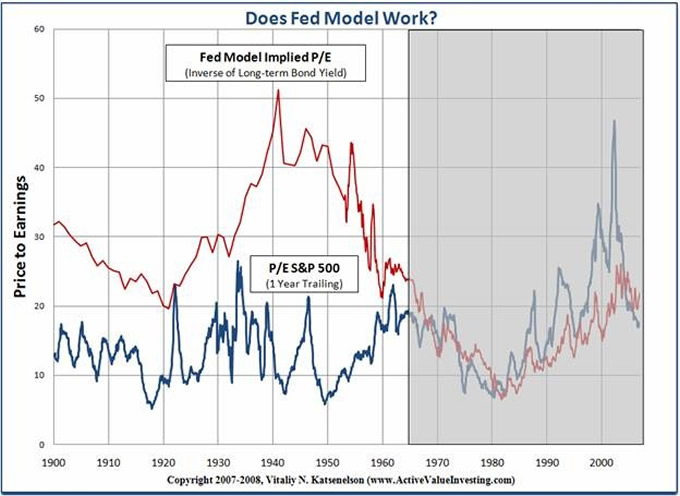
By taking a look at the last full 1966-2000 range-bound/bull market cycle (see Exhibit 3), we can see that the Fed Model perfectly predicted the direction of equities in relation to interest rates (okay, assuming you could predict interest rates). Long-term interest rates were rising from 1966 to 1982, while implied and actual P/Es were falling. Whereas from 1982 to 2000 interest rates were dropping, and implied and actual P/Es were rising. Intellectually that makes sense, because stocks and bonds compete for investors' capital, and thus higher interest rates make equities less attractive and vice versa.
However, it is hard to find ANY relationship between interest rates and the animal with its name on the secular market if you look at the first 66 years of the 20 th century. None!
It is difficult to dismiss the role interest rates play in stock valuations, but they seem to be a second fiddle in the orchestra conducted by economic growth and valuation. If the Fed Model worked flawlessly, how could we explain declining P/Es of Japanese stocks in the last decade of the 20 th century, when interest rates declined and were scratching zero levels?
It is valuation! If earnings growth in the long run remains consistent with the past, P/E is the wild card that is responsible for future returns. Though continued economic growth appears to be a wildly optimistic assumption given the meltdown of the housing industry in particular, and job layoffs, it is not particularly unrealistic to predict that we will see economic growth overall. With the exception of the Great Depression (see Exhibits 1 & 2), though it had its ups and downs, economic growth was fairly stable throughout the 20 th century. Earnings, though more volatile than real GDP, grew consistently decade after decade, paying no attention to the animal (bull, bear ... or cowardly lion - my pet name for range-bound markets, whose bursts of occasional bravery lead to stock appreciation, but which are ultimately overrun by fear that leads to a subsequent descent) lending its name to the stock market.
Though economic fluctuations were responsible for short-term (cyclical) market volatility, as long as economic performance was not far from the average, long-term market cycles were either bull or range-bound. Valuation - the change in price to earnings, its expansion or contraction - was the wild card that was mainly responsible for markets being in a bull or range-bound state.
Market Cycle Math
So let's examine the stock market math for secular bull, range-bound, and bear markets. The following Exhibit 4 shows sources of price appreciation in past bull, range-bound, and bear markets.
Exhibit 4
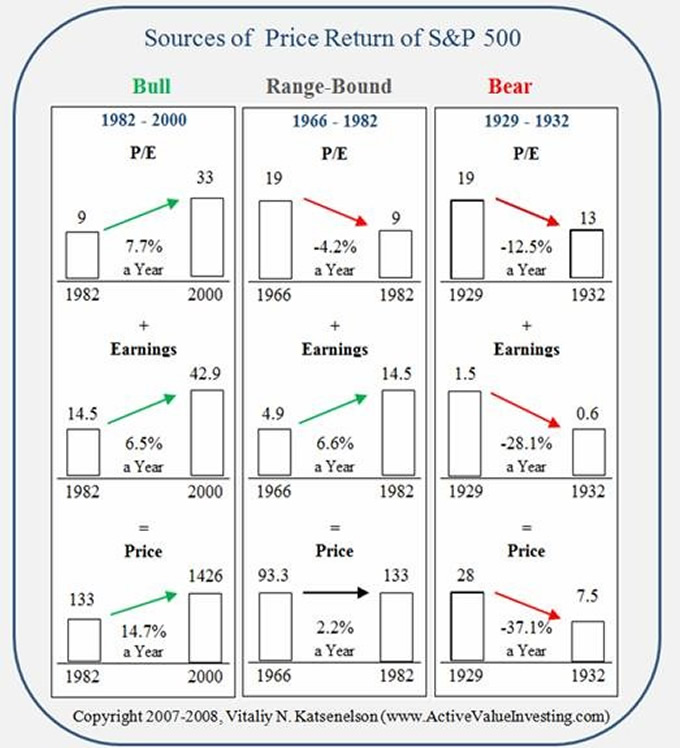

During bull markets, a vibrant, peaceful combination of P/E expansion (a staple of bull markets, a great source of return) and earnings growth brings outsize returns to jubilant investors. Prolonged bull markets start with below- and end with above-average P/Es.

P/Es are some of the most mean-reverting creatures, and range-bound markets act as clean-up guys: they rid us of the mess (i.e., deflate high P/Es) caused by bull markets, taking them down towards and actually below the mean. P/E compression wipes out most if not all earnings growth, resulting in zero (or nearly) price appreciation plus dividends.

Bear markets are range-bound markets' cousins; they share half of their DNA: high starting valuations. However, where in cowardly lion markets economic growth helps to soften the blow caused by P/E compression, during secular bear markets the economy is not there to help. Economic blues (runaway inflation, severe deflation, subpar or negative economic or earnings growth) add oil to the fire (started by high valuations) and bring devastating returns to investors.
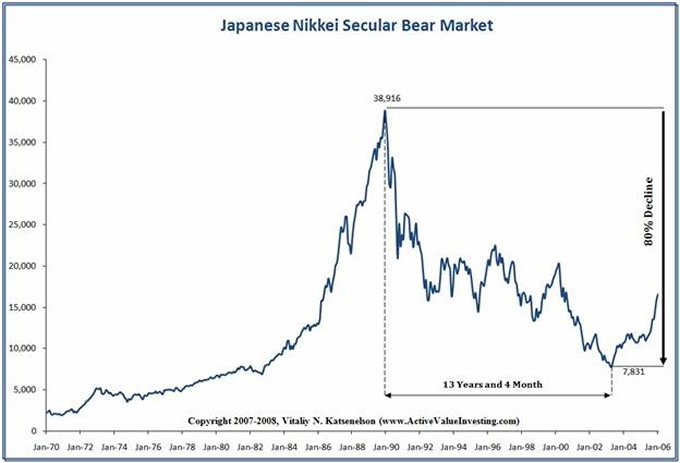
A true secular bear market has not really taken place in the US, but one has occurred across the pond in Japan. The market decline caused by the Great Depression, though referred to as the greatest decline in US stocks in the 20 th century, only lasted three years and thus doesn't really fit the traditional "secular" requirement of lasting more than five years. Japan's Nikkei 225 suffered (see Exhibit 5) through a true secular bear market: stock prices declined over 80 percent from their 1989-1991 highs until they bottomed in 2003 (the market seems to be coming back now). For more than a decade the country struggled with deflation caused by its banking system coming to a near halt on the heels of a collapsing real estate market and the bad loans that came with it. Of course, all this took place on the heels of a huge bull market, and thus very high valuations.
Exhibit 5
A unique aspect that contributed to the severity and longevity of the Japanese deflation was a cultural issue: the Japanese government intervened and did not allow structurally defunct companies to go bankrupt, thus tampering with the nucleus of capitalism (and Darwinism as well), creative destruction. I must admit, it seems that lately we've been importing a lot more from Japan than their cars and flat-screen TVs, as the US government steps in to "fix" our troubled financial firms. (In the following articles I argue against government bailing out homeowners and against the Fed bailing out the economy ).
Where Are We Today?
Today stocks may appear cheap at first glance, at least if you look at valuations of the late 1990s. They are not! To minimize the impact of cyclical profit volatility, let's first take a look at stock market historical and current valuations, based on 10-year trailing earnings, as shown in Exhibit 6. This way we capture a full economic cycle.
Exhibit 6
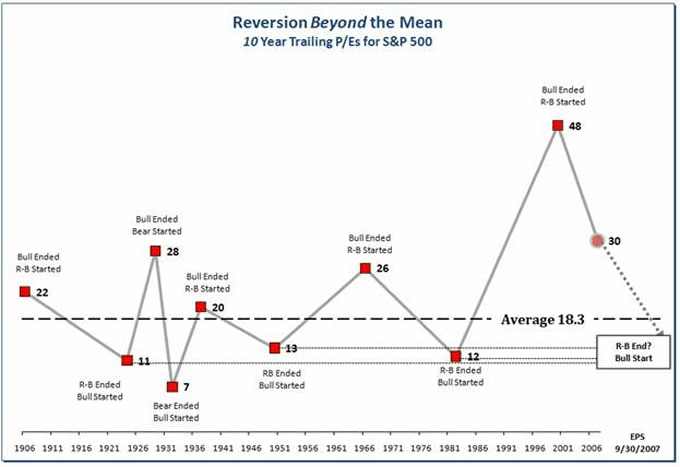
The conclusions we can draw are:
- Secular bull markets end at P/Es much above average. The 1982-2000 bull market ended at the highest valuations ever!
- Secular range-bound markets ended when P/Es were below average.
- Markets spent very little time at what is known to be a "fairly valued" state of 15 times 12-month trailing earnings. Historically, stocks only saw average valuations on the way from one extreme to the other. From 1900 to 2006 the S&P 500 spent less than 27% of the time between P/Es of 13 and 17.
- Today, after eight years of plentiful volatility and no returns, what the WSJ called a "lost decade," stocks are not cheap. If you look at ten-year trailing earnings, they are still at levels where previous range-bound markets started. In other words, based on 10-year trailing earnings, stocks are still at 64% above their average stated valuations.
Now, if you look at historical valuations where P/Es are computed based on one-year trailing earnings (see Exhibit 7), the picture is not that exciting but less grim. At about 18 times trailing earnings, US stocks don't appear that expensive.
Exhibit 7
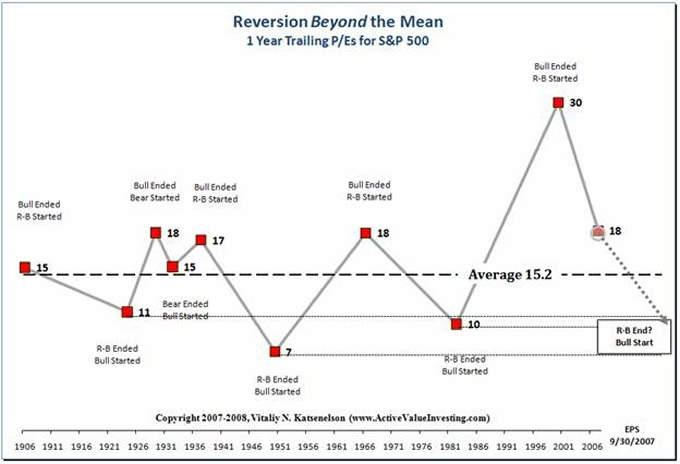
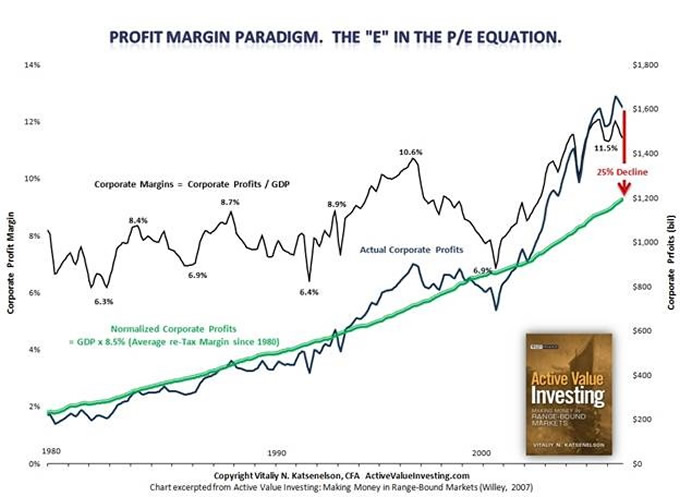
Unfortunately, the cheapness argument falls on its face once you realize that (pretax) profit margins are hovering at an all-time high of 11.5%, about 35% above their historical (since 1980) average of 8.5%. Similarly to P/Es, profit margins are extremely mean-reverting. As companies start to earn above-average economic profits, new competition waltzes in and competes these excess profits away - arrivederci fat profit margins. Once this happens, the "E" in the "P/E" equation will decline as well, and P/Es will rise from 18 to 22. An additional point: as you see in Exhibit 8, margins don't have to revert and stop at the mean; historically they've gone below the mean - that is how the mean is created. (In the February 4 th , 2008 issue of Barron's I rebuffed common arguments against profit-margin mean reversion.)
Exhibit 8
As a side note: The bulk of excesses in overall profit margins, 54.5% to be exact (see Exhibit 9), were in "stuff" stocks (i.e., energy, materials, and industrials). Profit margins will deflate when the global economy slows down. This goes far beyond oil and commodities. Companies that make "stuff," which historically have been very cyclical (today is no different) have benefitted from tremendous operational leverage that contributed to considerable improvement in margins. However, leverage works both ways: lower sales and high fixed costs will push margins to the other extreme.
Exhibit 9
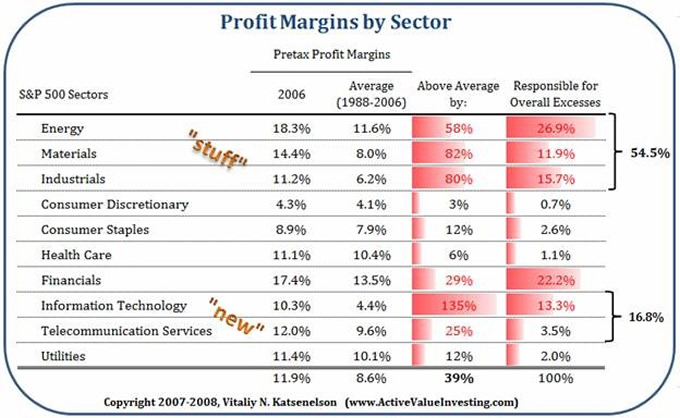
Financials were responsible for 22% of the excess in margins, as they benefitted from tremendous liquidity hosed down by the Fed over recent years; now they are drowning in it. Their margins are compressing at a faster rate than you can read this.
Finally, the "new" economy stocks are responsible for 17% of the excess. However, I'd argue that these industries have transformed substantially since 1988, so that higher-margin software and services now account for a much larger portion of technology and telecom sales. It is kind of like Microsoft (ironically the "new" economy) vs. IBM in 1988: the hardware company (the old economy) vs. the new. Of course IBM of today is lot more of a software and service company than the hardware company it was in the 1980s. Thus the "new" economy stocks should have higher margins than they did in 1988, but by how much? I don't know, but they likely will face a lower margin compression than "stuff" and financials.
The bottom line: Remember those long-term double-digit returns you were promised by stock market gurus during the last bull market? Well, an average passive buy-and-hold investor will be lucky to have very low single-digit returns for the long term. In fact, during the last 1966-1982 range-bound market, investors received almost zero real total returns.
Analyze and Strategize
Fairly depressing stuff, and it sounds like the investor is going to have to eat lower returns. However, there are strategies to improve portfolio performance so that one can do well, even in a trading range. Whether you are a buy-and-hold or stalwart value investor, there are opportunities that don't require you to day trade stocks. You don't have to change your investment philosophy, but you have to tweak your stock analysis and strategy a little to adapt it to range-bound markets.
Modify your analysis: To clarify, I created an analytical framework where stock analysis is broken down into three dimensions: Quality, Valuation, and Growth.
Quality. Though often it is in the eye of the beholder, in my book I clarify what constitutes a quality company (i.e., sustainable competitive advantage, strong balance sheet, great management, high return on capital, and a lot more). But the lesson here is, you want to compromise as little as possible on this dimension, because it is very difficult to recover from significant losses in the range-bound market. Stick to quality.
Growth. This dimension consists of earnings (cash flows), growth, and dividends. When you own companies that grow earnings, time is on your side. Dividends are extremely important in range-bound markets, in fact 90% of the returns in past range-bound markets came from dividends, vs. less than 20% in past bull markets. Also, today an average stock (i.e., S&P 500 index) yields only 1.7%. Do you really want 1.7% to be 90% of your total return?
Valuation. This dimension requires the most modification: the valuations that we saw in the 1982-2000 bull market are not coming back anytime soon, but don't step into what I call the relative valuation trap. Don't buy stocks based solely on their relative cheapness to their prices in the past, but rather based on what their future cash flows will bring. To combat a constant P/E compression, in the range-bound market increase your required margin of safety.
That value (i.e., low P/E stocks) beats growth (high-valuation stocks that have high expectations built in) has been historically documented by numerous studies. After doing extensive study of the 1966-1982 range-bound market, I found that value kills growth. Cheaper stocks had a lower P/E compression and generated bull-market-like returns, plus they had a natural advantage: their lower P/Es led to higher dividend yields. Stock selection matters in the range-bound market. Blindly throwing money at market indices - a strategy that did wonders in the past bull market - will bring market-like returns, which likely will not pay for your dream house or fund your retirement.
Strategize: Once you have determined, based on the Quality, Valuation, and Growth framework, what stocks are to be bought and at what prices, you can start applying a range-bound market strategy.
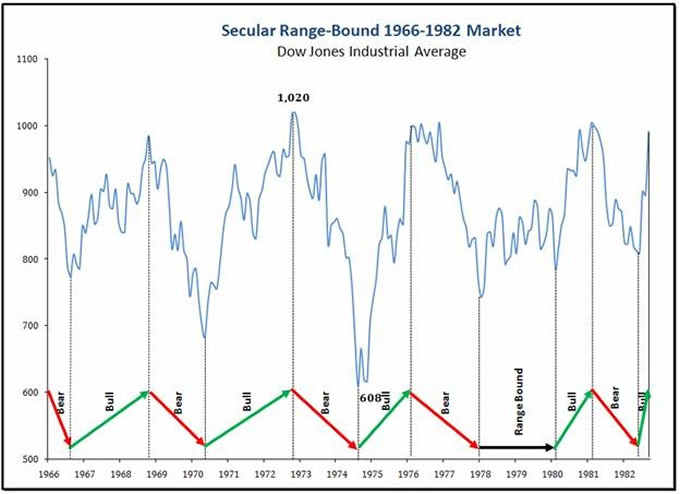
A long-lasting secular range-bound market consists of many mini (months to several years long) cycles. For instance, the last 1966-1982 range-bound market consisted of five mini bull, five bear, and one range-bound market (See Exhibit 10).
Exhibit 10
Successful investing is a lonely place, as it requires an independent thought process that often goes contrary to the herd mentality. In the range-bound market, a contrarian mindset comes in especially handy, as you'll be selling when everyone else is buying. Your stocks will be hitting their fair value, and you'll be buying when everyone else is selling - during the mini bear markets.
This is not to suggest that you need to be a market timer, not at all. Market timing only looks easy with the benefit of hindsight, and it is very difficult to do on a consistent basis. Instead, time (price) individual stocks, one at a time. Buy when they are undervalued and sell when they are fairly valued, and repeat the process over and over again. In other words, instead of focusing on the bowling alley (the market) focus on the ball (individual stocks).
Selling is looked upon as a four-letter word, and therefore a sin, in a bull market. A buy-and-hold strategy (which is often just buy and forget to sell) is rewarded richly in secular bull markets - every time you made a "don't sell" decision, stocks go higher. And though buy and hold is not dead but in a coma (waiting for the next bull market), it takes investors to a place of no returns. Forgive yourself the "sin" of selling and become a buy-and-sell investor.
The almighty US constitutes 4% of the world population, but its stock market capitalization represents more than a third of the world's wealth. It has been comfortable for us to buy US stocks; it felt safe. However, by solely focusing on US stocks we are insulating ourselves from a greater pool of stocks to choose from. You don't need to become an Indiana Jones of international investing by venturing into fourth-world countries like South Paragama or Liberania (ok, I made those up, didn't want to offend folks in Turkmenistan or some other places heading towards the stone age), but there are plenty of countries that have a stable political regime and the rule of law.
I could be wrong but I doubt it
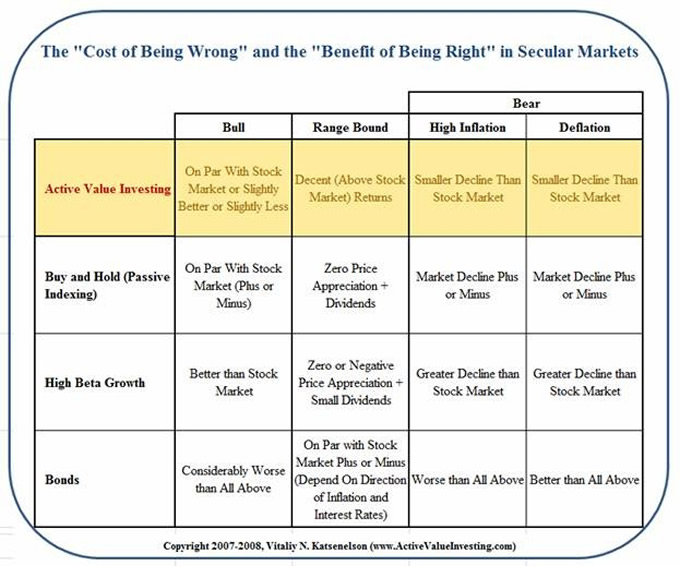
What if I am wrong and the range-bound market I describe is not in the cards? After all, history is prolific about the past but mute about the future. What if they find life on Venus and our economy starts growing at double digits and the secular bull market thunders upon us? Or the current credit market problems spill into a Japanese-like prolonged recession, causing a bear market? Every strategy should be evaluated not just on a "benefit of being right" basis, but at least as importantly on a "cost of being wrong" basis. An active value-investing strategy has the lowest cost of being wrong in comparison to other investment strategies, as you'll see in Exhibit 11.
Exhibit 11
Switzerland, Planes
I was one of 300,000 people who had their American Airline flights cancelled this week. I got to San Diego from Dallas on Southwest with a mere three stops, and am grateful I could get here, although I did miss dinner with Richard Russell. Hopefully, things will be back to normal soon. I must admit to not understanding why the FAA could not have chosen a more deliberate approach to pulling planes out of the system. It does not appear to be a real near-term safety issue. A lot of people were seriously inconvenienced, and I can't even begin to imagine how much it cost business and consumers, not just in money but in time.
As noted above, I am at my fifth annual Strategic Investment Conference in La Jolla. It is sold out at about 280 attendees. Somehow, only two people had to cancel due to American Airline problems. It is good to see old friends and new ones, and the conversations have been very stimulating. I am hopeful that we can get some of the presentations up on the web soon.
I am off to London and then Switzerland this Monday on American. I am looking forward to being a tourist for a few days in the Interlaken area of Switzerland, after my speech for Bank Sarasin, and then back next Monday.
Have a great week!
Your always a believer in value analyst,
By John Mauldin
John Mauldin, Best-Selling author and recognized financial expert, is also editor of the free Thoughts From the Frontline that goes to over 1 million readers each week. For more information on John or his FREE weekly economic letter go to: http://www.frontlinethoughts.com/learnmore
To subscribe to John Mauldin's E-Letter please click here:http://www.frontlinethoughts.com/subscribe.asp
Copyright 2008 John Mauldin. All Rights Reserved
John Mauldin is president of Millennium Wave Advisors, LLC, a registered investment advisor. All material presented herein is believed to be reliable but we cannot attest to its accuracy. Investment recommendations may change and readers are urged to check with their investment counselors before making any investment decisions. Opinions expressed in these reports may change without prior notice. John Mauldin and/or the staff at Millennium Wave Advisors, LLC may or may not have investments in any funds cited above. Mauldin can be reached at 800-829-7273.
Disclaimer PAST RESULTS ARE NOT INDICATIVE OF FUTURE RESULTS. THERE IS RISK OF LOSS AS WELL AS THE OPPORTUNITY FOR GAIN WHEN INVESTING IN MANAGED FUNDS. WHEN CONSIDERING ALTERNATIVE INVESTMENTS, INCLUDING HEDGE FUNDS, YOU SHOULD CONSIDER VARIOUS RISKS INCLUDING THE FACT THAT SOME PRODUCTS: OFTEN ENGAGE IN LEVERAGING AND OTHER SPECULATIVE INVESTMENT PRACTICES THAT MAY INCREASE THE RISK OF INVESTMENT LOSS, CAN BE ILLIQUID, ARE NOT REQUIRED TO PROVIDE PERIODIC PRICING OR VALUATION INFORMATION TO INVESTORS, MAY INVOLVE COMPLEX TAX STRUCTURES AND DELAYS IN DISTRIBUTING IMPORTANT TAX INFORMATION, ARE NOT SUBJECT TO THE SAME REGULATORY REQUIREMENTS AS MUTUAL FUNDS, OFTEN CHARGE HIGH FEES, AND IN MANY CASES THE UNDERLYING INVESTMENTS ARE NOT TRANSPARENT AND ARE KNOWN ONLY TO THE INVESTMENT MANAGER.
John Mauldin Archive |
© 2005-2022 http://www.MarketOracle.co.uk - The Market Oracle is a FREE Daily Financial Markets Analysis & Forecasting online publication.