Best of the Week
U.S. Economy Reflation Challenge and LIBOR Deceptive Manipulation - 19th Nov 08
Economic Forecast, Peering into a Debt Ridden Future - 19th Nov 08
Misguided Bets On The Yield Curve Steepening - 19th Nov 08
What's Frightening Saudis and Iranians into Buying Gold? - 19th Nov 08
Stock Market Apocalyptic Crash Soon? S&P at the Tipping Point - 19th Nov 08
The Road to Financial Ruin: Unrestrained Government Spending - 19th Nov 08
Investing in Stocks During Scary Times - 19th Nov 08
US Capital Markets Portfolio Composition - 19th Nov 08
Spreading Global Recession Signals Caution for Investors - 18th Nov 08
G20 Central Banks Unite to Fight Economic Depression - 18th Nov 08
UK Inflation CPI Falls Sharply as Economy Heads for Deflation - 18th Nov 08
U.S. Treasury the Final Bailout - 18th Nov 08
What's ahead for Apple (AAPL), A Stock Worth Shorting? - 18th Nov 08
Worse than the Great Depression? - 18th Nov 08
Stock Market is Not in Uncharted Territory - 18th Nov 08
G20 Meaningless Statement and the Manageable Recession - 18th Nov 08
FINANCIAL PLANNING: My Guess Or Yours? - 17th Nov 08
Critical Week for Global Stock Markets and Economic Recovery - 17th Nov 08
U.S. Dollar Bullish Worlds Reserve Currency Dynamics - 17th Nov 08
The Ascent of Money and Descent of Niall Ferguson - 17th Nov 08
Citigroups Survival in Doubt as 50,000 Jobs Cut - 17th Nov 08
Flawed Central Banking System and Stocks Bear Market Bounce - 17th Nov 08
Gold Needs to Rise Above $838 to Fullfill Annual Minimum Bull Market Target - 17th Nov 08
Current Commodities Price Deflation to be Followed by Massive Inflation Later - 17th Nov 08
Stock, Commodities and Currency Futures Markets Analysis 17th November - 17th Nov 08
More Bailouts Coming, U.S. Automakers, Freddie Mac and Foreign Exporters - 17th Nov 08
The Brutal Truth About the Credit Crisis - 17th Nov 08
Stock Market Showing Signs of a Tradeable Low - 16th Nov 08
Peak Earnings and the Secular Stocks Bear Market - 16th Nov 08
Gold Long-term Bearish Projection Targets $480 - 16th Nov 08
G20 Economic Summit Changes Nothing - 16th Nov 08
Global Stock Market Crash Extended Leg Lower - 16th Nov 08
Extreme Stock Market Volatility as Corporate America Heads Towards Bankruptcy - 16th Nov 08
Stock Market Bear Still in Control - 16th Nov 08
Why the Dollar is Rising and Potential for Large Stock Market Rally - 16th Nov 08
US Dollar Bull Run, Gold, XOI, HUI, CBOE Put/Call Ratio - 16th Nov 08
G-20 Summit Politicians Blame Investors For Credit Crisis - 16th Nov 08
Bailout for GE But not Yet for GM - 15th Nov 08
End of the Era of Big Consumer Spending - 15th Nov 08
Hydrogen Energy, IEA-2008 World Energy, Climate Change and Fossil Fuel Depletion - 15th Nov 08
Hope for a Dismal Economy & Stock Market? - 15th Nov 08
Paulson's Blunders as Debt Securitization Market Remains Frozen - 15th Nov 08
Economic Forecasts and Analysis For U.S. Financial Markets (Nov 17-21) - 15th Nov 08
G7 Banking Systems Continue to Plunge into the Abyss - 14th Nov 08
Goldilocks Economy Turns into the Humpty Dumpty Economy - 14th Nov 08
The G-20's Secret Credit Crash Debt Solution - 14th Nov 08
Are We There Yet? Finding that Elusive Gold Stocks Bottom - 14th Nov 08
New Precedent for America : Financial Irresponsibility Pays - 14th Nov 08
Gold GLD ETF Impact on the Gold Market - 14th Nov 08
Consumer Spending Cutbacks Further Erode Retail Payrolls - 14th Nov 08
Gold Will Rise as Governments Reflate to Resurrect Economies - 14th Nov 08
U.S. Dollar Rallies Due to Global Destruction of Fiat Currencies - 14th Nov 08
Stock, Commodities and Currency Futures Markets Analysis 14th November - 14th Nov 08
Stock Market Rally Against the Primary Trend - 14th Nov 08
Stock Market Crash Count Update and Bullish Gold Stocks Divergence - 14th Nov 08
Japanese Stock Market Could Bounce in the New Year - 14th Nov 08
Combating Credit Based Derivatives Deflation - 13th Nov 08
Baltic Dry Index The Only Economic Indicator Worth Tracking - 13th Nov 08
Where Stock Market Valuations and Technical Support Intersect - 13th Nov 08
Stocks, U.S. Dollar and Crude Oil Video Analysis and Forecasts - 13th Nov 08
UK on the Brink of Economic Meltdown - 13th Nov 08
British Pound Crashes to New Lows as Economic Crisis Deepens - 13th Nov 08

Free Instant Analysis

Free Instant Technical Analysis


RSS Feeds

Most Popular 2008
1. The Great Depression 2008 - It can't happen to us....can it?”
2. The Battle for America Has Begun- Strategic Forecasts
3. UK House Prices Plunge Over the Cliff
4. US Banking System Teetering on the Brink of Collapse
5. US Economy Forecast 2008 - First Recession then Recovery
6. How Safe is My FDIC-Insured Bank Account?
7. Rising Risk of a Systemic Financial Meltdown:The 12 Steps to Financial Disaster By Nouriel Roubini
Most Popular 2007
1. US Housing Market Crash to result in the Second Great Depression
2. Operation FALCON - The USA is turning into a Police State
3. US Housing Bubble Meltdown: "Is it too late to get out"?
4. UK Housing Market Crash of 2007 - 2008 and Steps to Protect Your Wealth
5. Global Liquidity Crisis when the Credit Boom comes to an End
Most Popular 2006
1. Last Warning! Three-Pronged Collapse ... Stocks, Bonds and Real Estate
2. UK Interest Rate forecast for 2007 - Bank of England to do battle with inflation
3. UK Interest Rates Forecast to rise much higher due to rising Inflation and high Money Supply Growth
4. Emerging Markets outlook for 2007 - India, China, Russia, Eastern Europe and Brazil

Market Oracle FREE Newsletter

Best of the Month
November 08
Hope for a Dismal Economy & Stock Market?
Where Stock Market Valuations and Technical Support Intersect
Credit Crisis Worse to Come as Bank Credit Contracts
U.S. Economic Pain Precedes Greatest Investment Opportunity of a Generation
Gloom and Doom Folks Will Soon be Proven Wrong
Agri-Foods Long-term Opportunities Amidst Hedge Funds Deleveraging
Will Fortune Favour the Brave in This Crisis Investment Climate?
After Shocks from the October Financial Markets Crash
Transitions From Stocks Bear Markets To Bull Markets
The Great American Housing Market Nightmare Next Phase
Stock Market Investing Dividend Yields Vs Bond Yields Analysis
U.S. Elections and Performance of Stocks, Dollar and Economy
Emerging Markets Turnaround is Getting Closer—Here's Why
Current Economic Crisis Worse than the Great Depression
FTSE 100 Stock Market Index Forecast Year End Rally
Stock Markets Staring into the Abyss
October 08
Stock Market Price Earnings Reversion Towards the Mean
Comex Gold and Silver Markets Hurtling Towards Default
Crooked Central Bank Plumbing the Depths of Depravity
Wild Crude Oil Markets Long-term Trend
Stock Market Crash Investor Overreaction Value Investing
When Will the Stocks Bear Market End?
Bear Market Deleveraging Producing Incredible Value in Agri-Foods
U.S. Dollar Bull Market Update
U.S. Dollar Driven Gold Price Crash
S&P500 Stock Market Crash Compared to Nikkei Index
Investment Opportunities in Municipal Bonds?
Stocks Bear Market Long-term Investing Strategy
Understanding Derivatives to Understand the Credit Crisis
Zinc Two Year Bear Market Coming to an End?
Stock Market Will Bottom Well Before the Economy
The Mechanism Of Capital Destruction
Fed Fighting to Prevent 1930's Style Financial and Economic Deflation
The Financial and Economic Blue Screen of Death
The U.S. Housing Market Economic Double Negative Feedback Loop
Stocks Bear Market Has NOT Hit Bottom!
Financial Markets Crash Greatest Opportunity in History!
Gold Price Manipulation- Bear Stearns Murdered at the Golden Gates
Central Banks Panic as Bailouts Fail to Halt Stock Market Crash
Financial Crisis 2008 Similar to 1987 Stock Market Crash
UK Interest Rate Forecast 2009
U.S. Economy Rapidly Sinking Into Economic Depression
Manipulation of Gold and Commodity Prices to Prevent Inflation and Higher Interest Rates
Bailout Fixes Nothing, Banking System Collapse Approaches Climax
September 08
Financial Tsunami: The End of the World as we Knew it
Financial Catastrophe Entire Global Financial System in Collapse
End of the Financial World- LIBOR TED Spread Flashes Trouble
America's Financial Apocalypse, What Can YOU Do as an Investor?
Bailout Crisis - What Happens Next
Credit Crisis Analysis and Conclusions
Financial Armageddon and the Re-pricing of Collateralized Debt
Systemic Failure of the United States- Game Over
Is the United States In Recession?
BANKRUPT Banks Wiped Out by Tulip Backed Securities

Links
Money Forums
Certz
TradingTheCharts
Housing Market Forecasts

Gold and Silver Bull Market – The Fuse Is Lit!

Commodities / Gold & Silver May 09, 2008 - 12:42 AM

By: Peter_Degraaf

Commodities

Best Financial Markets Analysis ArticleMuch discussion has taken place in recent weeks, regarding the possibility that gold and silver might continue to sink to lower levels, as the summer doldrums set in.

Investors soon become shell-shocked with negative market analysis that looks at a half-full glass of water and refers to is as ‘half empty'.


They read about a member of the Federal Reserve Board who is quoted as saying that he is worried about inflation, and they interpret this to mean that the dollar is going to rise, and gold might fall, just because of that single comment. If the man was serious about his worry, he and his pals would be raising rates, not lowering them! Of course we know that their hands are tied, as the Fed cannot raise rates until the economy, especially the housing market, can handle higher rates.

The fact of the matter is that gold and silver are becoming more of a bargain on a daily basis . The reason is very simple: Every day, the central bank money spigots are spewing out at least ten times as much money, as miners are able to produce gold and silver!

Until this situation is reversed, the fundamentals will support higher prices.

Pull-backs or corrections usually swing too far in the opposite direction to the main trend, thereby providing opportunities for us to ‘buy the bargains'. This is the situation today.

For some examples of price increases:

  • Platinum has gone from 400.00 to 2,000.00, an increase of 400%
  • Copper from 0.75 to 4.00, an increase of 470%
  • Lead from 0.20c to 1.20, an increase of 500%
  • Uranium from 0.63 to 63.00, an increase of 530%
  • Crude oil from 12.00 to 124.00, an increase of 900%
  • Molybdenum from 2.50 to 32.50, an increase of 1300%
  • Rhodium from 400.00 to 9,400.00, an increase of 2200%

Many of these commodities are trading at all-time high prices!

By comparison, gold has crawled, from 260.00 to 880.00, for an increase of 338%. Gold is currently trading at 1/3 rd of its inflation adjusted previous high price.

Silver from 4.00 – 18.00 has increased by 350%

Silver is currently trading at 1/8 th of its inflation adjusted previous high price. That's right, silver has to increase by a factor of 8 times to reach 135.00, which is its 1980 price, when adjusted for inflation. And that's if you use the official CPI numbers. By using actual inflation data, the number is even higher.

Gold and silver are still bargains!

Charts courtesy www.stockcharts.com

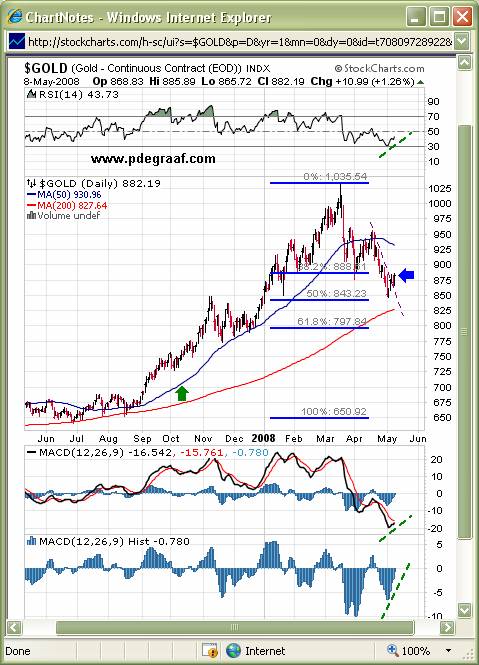
Featured is the daily gold chart. The correction that started in mid-March ended at the Fibonacci 50% level. Price today broke out above the current downtrend line (blue arrow), and is now headed for higher levels. The 3 supporting indicators are turning positive (green lines). The 50DMA is in positive alignment to the 200DMA (green arrow), the sign of a bull market. THE FUSE IS LIT!

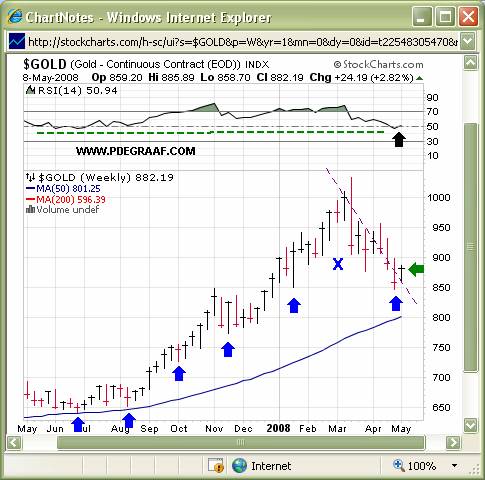
Featured is the weekly gold chart. The blue arrow points to the bottoming of the 7 – 8 week gold cycle. ‘X' marks the spot where the cycle missed, due to excessive bullishness. The cycle returned to normal on Friday May 2nd . The green arrow points to confirmation of the cycle. Unless gold closes below the thin purple line tomorrow, the upside breakout (green arrow), coming from beneath 8 weeks of resistance, will confirm the cycle bottom. (The thin dashed purple line connects the Friday closing prices).

The RSI is beginning to rise up from its support line (black arrow).

THE FUSE IS LIT!

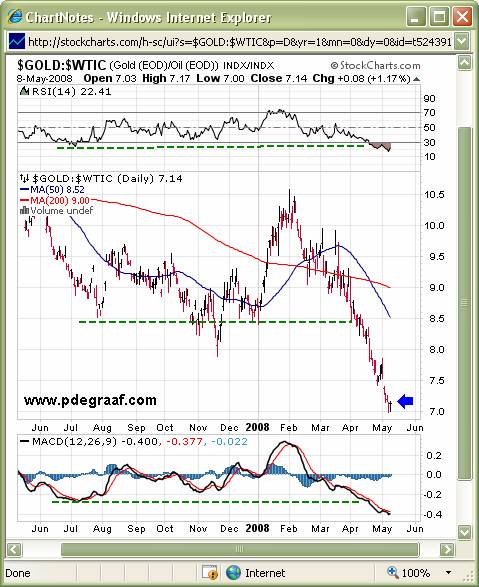
Featured is the index that compares gold to oil. Since the mid 1960's the historical average has been 15.4 barrels of oil equals an ounce of gold. Today this index touched 7, indicating that 7 barrels will buy an ounce of gold. GOLD IS HALF PRICE COMPARED TO OIL! The blue arrow points to a positive closing price today. This may indicate that the trend is about to change. The index at 7.14 is 26% below the 200DMA, which is extreme. The RSI and MACD are deeply oversold (green lines).

THE FUSE IS LIT!

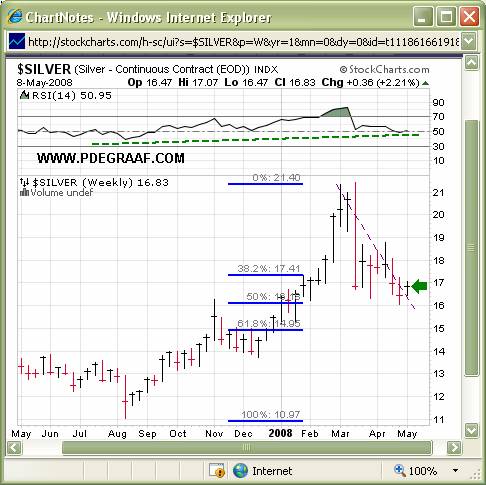
Featured is the daily silver chart. The correction which began in mid-March ended right at the Fibonacci 50% level. Confirmation will come at this Friday's close, providing silver closes somewhere near the green arrow, above the thin purple downtrend line, which connects the Friday closing prices for the past 9 weeks. The RSI is positive, and rising up from its support line (green line). THE FUSE IS LIT!

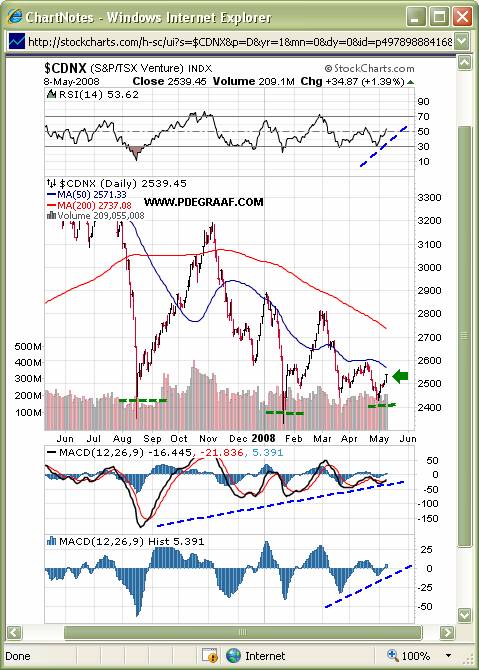
Featured is the CDNX index. The Juniors are ready to join the party! The index had its best day in over a month (green arrow), and is bouncing off a triple bottom (green lines).

The 3 supporting indicators are positive (blue lines). THE FUSE IS LIT!

Summary:

When you read a comment that is negative to a rising gold price, remember Gibson's Paradox: “When real interest rates (T-bills less CPI) are negative, gold will rise.”

This will keep you invested, while the bull rises in saw-tooth manner, ‘up two and down one'. To quote Richard Russell: “He who buys the dips, and rides the waves, wins in the end.”

By Peter Degraaf.

Peter Degraaf is an on-line stock trader, with over 50 years of investing experience. He issues a weekly alert to his subscribers. For a 60 day free trial, send him an E-mail itiswell@cogeco.net , or visit his website www.pdegraaf.com

DISCLAIMER: Please do your own due diligence. I am NOT responsible for your trading decisions.

Peter Degraaf Archive


Comments


Post Comment (Moderated)


Market Oracle Readership 2008 Awards Ballot