


Gold Triggers Short-term Bullish Trend
Commodities / Gold & Silver May 18, 2008 - 07:04 PM GMTBy: Merv_Burak

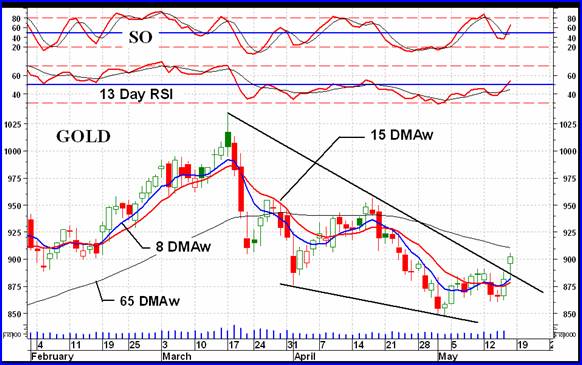
Friday looked like a break away but there is still some rough territory ahead to overcome. The $950/$960 area may be formidable.
GOLD : LONG TERM
The long term P&F chart is showing the direction of movement now on the up side but still some distance from reversing the P&F bear signal. That would need a move to the $960 level and then it would project only to the previous high for a mild move. My suspicions are that there will be more up and down volatility before any new reversal comes about. But time will tell, one should not be so set in one's view that one cannot change when the activity warrants.
We have a completely different picture when going to our regular charts and indicators. These have not yet shown us a long term bear market, weakness yes but not yet a bear. Two weeks ago it almost made the bear rating but could only get to a minus neutral rating. Since then the Index has been strengthening and is back in the green. Although the Index had been oscillating above and below my long term weighted moving average line the line had remained positive. It is now well above the line once more and the line continues to head higher. Throughout the past few weeks of weakness the long term momentum indicator had remained above its neutral line in the positive zone but below its negative sloping trigger line. This week the momentum indicator has moved above its trigger line although the trigger has not yet turned to the up side. I went back to a bullish rating last week and this week the rating remains BULLISH.
INTERMEDIATE TERM
On the intermediate term things are also looking brighter but still with some reservations. The Index is still below its intermediate term moving average line and the line continues to point downward. The momentum indicator, however, is now above its neutral line in the positive zone and its trigger line has turned upward. Although the price trend is still negative, i.e. below its negative moving average line, it has broken above that downward sloping wedge pattern for a bullish message. This goes along with the positive message from the momentum itself.
Although there are a few positives the intermediate term rating only gets upgraded to a – NEUTRAL rating due to the negative moving average info. However, it is obvious that the direction is to the up side and that this rating should get improved pretty quickly.
SHORT TERM
As far as the short term is concerned that Friday action sure looks like a break away, although not the kind of break away that has a “gap” attached to it. Still, the Index is above both its short and very short term moving average lines with both lines sloping upwards. The very short term has even moved above the short term indicating some strength behind the move. The short term momentum indicator is confirming a move in progress by crossing its neutral line to the up side with its trigger following behind. The more aggressive Stochastic Oscillator (SO) is also in its positive zone and moving higher. From all this the short term rating could only be BULLISH and the immediate direction of action is to the up side.
PRECIOUS METAL STOCKS
A Tale of Two Indices
I thought I'd show two gold Indices that seem to be telling us different stories. One is the popular AMEX Gold BUGS Index, probably the most popular gold Index for those looking to see how the more aggressive stocks are doing. The other Index is my own Merv's Gold & Silver 160 Index, which shows how the AVERAGE price of 160 gold and silver stocks is doing. Within this group of 160 stocks are the 100 largest stocks traded on the North American markets, by market value. The remaining 60 stocks include many of the more aggressive and speculative exploration variety of stocks. As mentioned, the two Indices seem to be giving us a different story.
Both Indices made a low in May of 2005. Both advanced for a year making new highs. Both then took a rest, reacting and moving sideways finally making a low in early October of 2006. So far, so good. However, after that they seemed to be moving to different music.
The HUI, after a minor rally that did not exceed its resistance level, moved sideways for almost a year. The 160, however, had a good rally into new all time highs finally topping out in April of 2007 and then having a reaction. It bottomed in August of 2007 at the same time that the HUI made a reaction low.
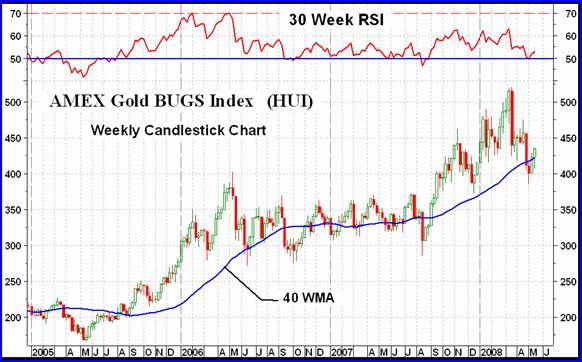
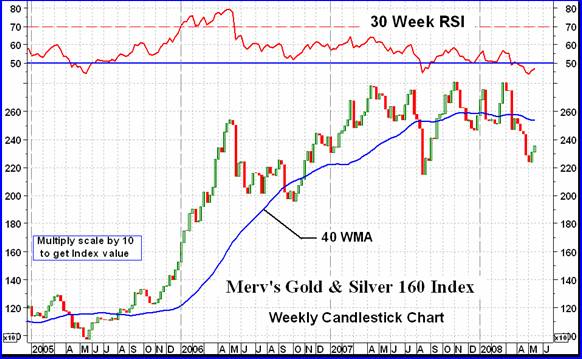
Now the HUI made a good rally into new all time highs in March of this year and is now in a minor reaction. The 160 tried to rally but could not decisively break through its previous high. While the HUI was climbing into new all time highs this year the 160 was moving sideways. While the HUI stayed above its December reaction low the 160 moved considerable below its December low. Finally, while the long term 40 WMA (or 200 DMA) has remained pointing upwards in the HUI it has already topped out and is pointing downward in the 160 Index.
There are many definitions as to what a momentum indicator is. I like to think of the momentum indicator as giving us a reading of the internal strength of recent price movements relative to the time period being analyzed. I like the Relative Strength Index (RSI) for this task.
The HUI RSI had basically been confirming the lateral trend of the Index since its peak in 2006. The RSI did improve somewhat during the rally from late 2007 to early 2008 BUT was under performing versus the Index during that time. It is still above its neutral line, in the positive zone.
The 160 RSI also started as a lateral strength reading until early 2006. From then until now the RSI has been progressively showing weakness in the 160 Index movement. It had moved into its negative zone and is still there.
Why do I bring all this up?
It is a common occurrence that when investors and speculators are unhappy with the market action they gravitate towards the higher quality stocks. When they become more sure of the up trend of the market they gravitate towards the more aggressive or speculative stocks. The action between these two Indices suggest that for many months now the investors and speculators have not been too enamored with this market and have been continuously getting out of the more aggressive stocks, that are a major representation in the 160 Index. They are not yet jumping back in so at this point they still seem to be down on the speculative stocks. That, unfortunately, is too often a forerunner to a full bear market in all gold stocks, including eventually the quality issues. The quality will be the last to turn.
This fairly long topping action in the 160 may be foretelling of a long term bear market ahead. I hope not and I will be following the market action week to week but that's what that 160 topping activity seems to be suggesting.
I think I'll end it there for this wee
Merv's Precious Metals Indices Table
That's it for this week.
By Merv Burak, CMT
Hudson Aero/Systems Inc.
Technical Information Group
for Merv's Precious Metals Central
For DAILY Uranium stock commentary and WEEKLY Uranium market update check out my new Technically Uranium with Merv blog at http://techuranium.blogspot.com .
During the day Merv practices his engineering profession as a Consulting Aerospace Engineer. Once the sun goes down and night descends upon the earth Merv dons his other hat as a Chartered Market Technician ( CMT ) and tries to decipher what's going on in the securities markets. As an underground surveyor in the gold mines of Canada 's Northwest Territories in his youth, Merv has a soft spot for the gold industry and has developed several Gold Indices reflecting different aspects of the industry. As a basically lazy individual Merv's driving focus is to KEEP IT SIMPLE .
To find out more about Merv's various Gold Indices and component stocks, please visit http://preciousmetalscentral.com . There you will find samples of the Indices and their component stocks plus other publications of interest to gold investors.
Before you invest, Always check your market timing with a Qualified Professional Market Technician
Merv Burak Archive |
© 2005-2022 http://www.MarketOracle.co.uk - The Market Oracle is a FREE Daily Financial Markets Analysis & Forecasting online publication.