


The Massive Debt Bubble Will Push Silver Prices Much Higher
Commodities / Gold and Silver 2015 Sep 22, 2015 - 12:28 PM GMTBy: Hubert_Moolman

 Silver had a spectacular rise in price from about August 2010 to April 2011. In fact, it was so impressive that some thought the peak was the end of the bull market for silver. After all, silver had risen about 12.33 times from its bottom in 2001.
However, from the fact that the April 2011 did not surpass the all-time high of 1980, it should have been evident that this was no end of a bull market. Real bull markets form peaks much higher than any previous highs.
Take the Dow's bull markets as an example. It went from 41.22 in July 1932 to 1067 at the beginning of 1973. That is a 40-year bull market where the Dow increased 25.89 times in value. The peak of that bull market (1067) was multiples higher than the previous all-time high (381.17 in 1929).
Again, the current Dow bull market peak (18 312 - current peak) came 40 years after the Dec 1974 bottom (570). This is a 32.13 times increase in the value of the Dow, and again; the peak is multiples higher than the previous all-time high (1067 in 1973).
Below is a comparison of silver's current bull market and the previous one:
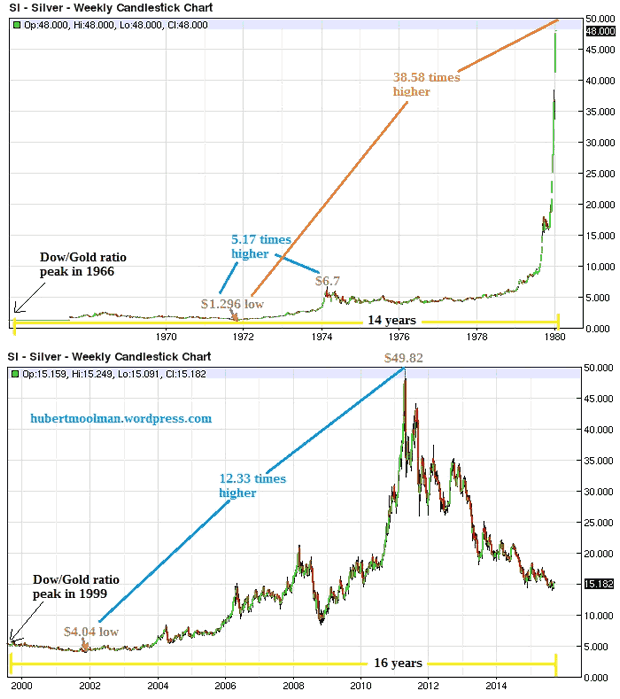
On the above graphic (charts generated at barchart.com), the bottom chart is the current silver bull market from 1999 to 2015, compared to the bull market of the 60s and 70s, the top chart. The previous bull market in silver was about 14 years long, from a peak in the Dow/Gold ratio to the bottom in Dow/Gold ratio. The current bull market is 16 years, from the peak in the Dow/Gold ratio to now.
The current bull market is bigger than the previous bull market in terms of price movement and time. During the previous bull market, silver made an interim peak that was about 5.17 times higher than the low in 1971. I believe that the April 2011 high in silver is in a similar manner the interim peak for this bull market. The April 2011 peak was 12.33 times higher than the 2001 low, which means that the current bull market appears much stronger than the previous one. Reasons for this were previously explained.
The previous bull market high was 38.58 times higher than the low of that bull market. The current bull market high can potentially exceed the 38.58 times, given the factors that favour a better silver performance during this bull market.
The April 2011 peak of this bull market, exists in very similar conditions to that of the interim high in the previous bull market, as illustrated in a previous article. This makes it very probable that we will see a rally in silver over the next several years, similar to the 1979 to January 1980 rally.
In my view, the silver price will, as a minimum, equal the 38.58 times rise of the previous bull market. That would give us a minimum target of $155.86 (4.04 times 38.58). The context of this silver bull market and the massive debt levels today, suggest that silver will go much higher.
For more of this kind of analysis on silver and gold, you are welcome to subscribe to my premium service. I have also recently completed a Long-term Silver Fractal Analysis Report .
Warm regards
Hubert
“And it shall come to pass, that whosoever shall call on the name of the Lord shall be saved”
http://hubertmoolman.wordpress.com/
You can email any comments to hubert@hgmandassociates.co.za
© 2015 Copyright Hubert Moolman - All Rights Reserved
Disclaimer: The above is a matter of opinion provided for general information purposes only and is not intended as investment advice. Information and analysis above are derived from sources and utilising methods believed to be reliable, but we cannot accept responsibility for any losses you may incur as a result of this analysis. Individuals should consult with their personal financial advisors.
© 2005-2022 http://www.MarketOracle.co.uk - The Market Oracle is a FREE Daily Financial Markets Analysis & Forecasting online publication.