


SPX: corrective advance
Stock-Markets / Stock Markets 2016 Oct 01, 2016 - 01:48 PM GMTBy: Tony_Caldaro

 The market started this choppy week at SPX 2165. After a gap down opening on Monday (DB related) the market declined to SPX 2142 by Tuesday’s open. After that it rallied to SPX 2173 Thursday morning. Then sold off (DB related) to SPX 2145 by Thursday afternoon. After a late day rally on Thursday the market gapped up on Friday (DB related) and hit SPX 2175. For the week the SPX/DOW gained 0.25%, and the NDX/NAZ gained 0.25%. Economic reports were mixed. On the downtick: Case-Shiller, the Q3 GDP estimate, pending/new home sales, plus weekly jobless claims rose. On the uptick: Q2 GDP, consumer confidence/sentiment, personal income, the Chicago PMI and the PCE. Next week’s reports will be highlighted by monthly Payrolls and ISM.
LONG TERM: uptrend
The month of September started off with a high of SPX 2188, then a decline to 2119/2120 by mid-month. Then while we were expecting a new uptrend to get underway, all the market could offer was lots of choppy activity. As every rally was sold. If the SPX/DOW are indeed in an uptrend, we cannot envision it being anything more than a B wave within a Minor wave 2 correction. It is just too choppy.
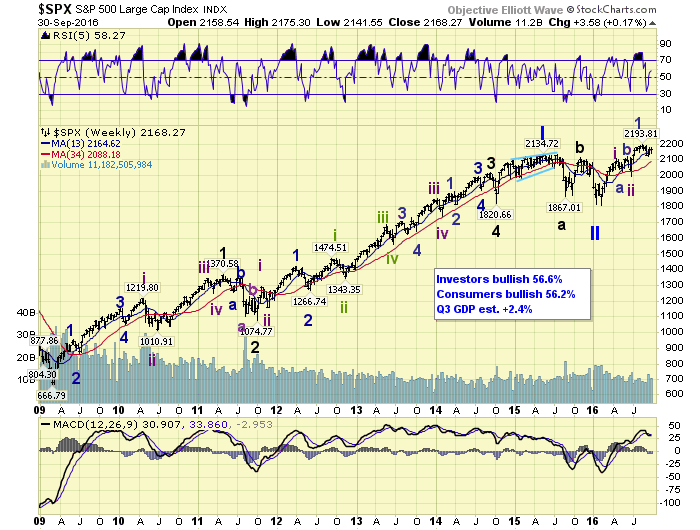
The long term count remains unchanged. Primary wave I ended in 2015, and Primary wave II ended in February. A Primary III bull market began at that time. Thus far we have observed an Intermediate wave i uptrend, and an irregular Intermediate wave ii. Then a Minor wave 1 uptrend, followed by a Minor 2 downtrend. When Minor wave 3 gets underway it will be quite obvious. And the recent activity is not it. Nothing to add to the alternate counts, as they have not accomplished much of anything recently either.
MEDIUM TERM: uptrend/downtrend looks correctional
After making an all time high in mid-August the SPX ended its Minor 1 uptrend and headed into a correction. The market declined into early-September and hit SPX 2119. The low at SPX 2119/2120 could have ended the downtrend, and a new uptrend was underway. However, as noted earlier, the advance since then does not look impulsive at all. It is certainly not a Minor 3 wave, and looks more like a Minute B wave of an ongoing Minor 2.
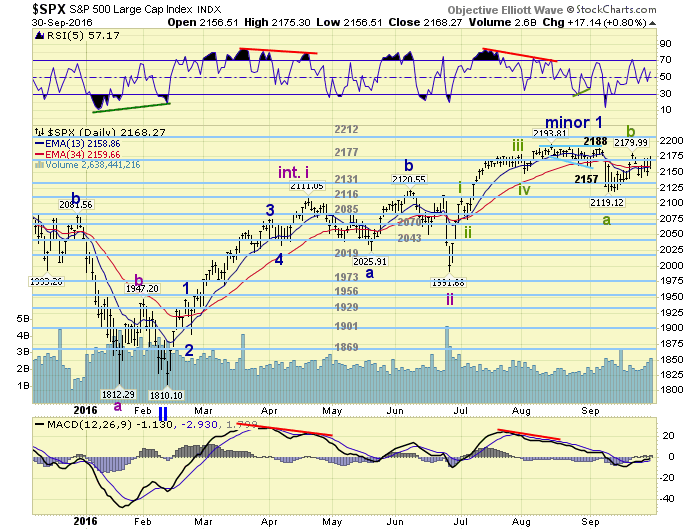
Reviewing the daily chart you will observe Intermediate wave ii unfolded in three trends. A Minor A downtrend, a Minor B uptrend to a slightly higher high, then a Minor C downtrend. This is called an irregular correction. Irregular in that it made a higher high during the correction. It is possible we are witnessing a similar event underway now. Only on a wave degree of one lesser scale. In other words the SPX could make a marginal all time new high, and then head right back down to complete an irregular Minor wave 2 correction.
This possibility would fit with the recent uptrend confirmations in the NDX/NAZ, and the 80% uptrend probability noted last week in the SPX. In either case, uptrend gets confirmed or does not, the most probable scenario suggests a retest of the 2116 pivot or lower in coming weeks. Medium term support is at the 2131 and 2116 pivots, with resistance at the 2177 and 2212 pivots.
SHORT TERM
After the mid-September low at SPX 2119/2120 we observed several rallies that were immediately sold off, but not fully retraced. Then there was a spike up to SPX 2180 post the FOMC meeting that was also sold off. In a broader sense we can see a double zigzag from SPX 2120: 2154-2136-2180. Then a drop to SPX 2142. This is currently followed by another potential double zigzag: 2173-2145-2175 so far. It would appear the SPX 2142 level is key support for this pattern to continue. And a rally above SPX 2180 should offer the potential to hit the 2194 all time high, or even the 2212 pivot range.
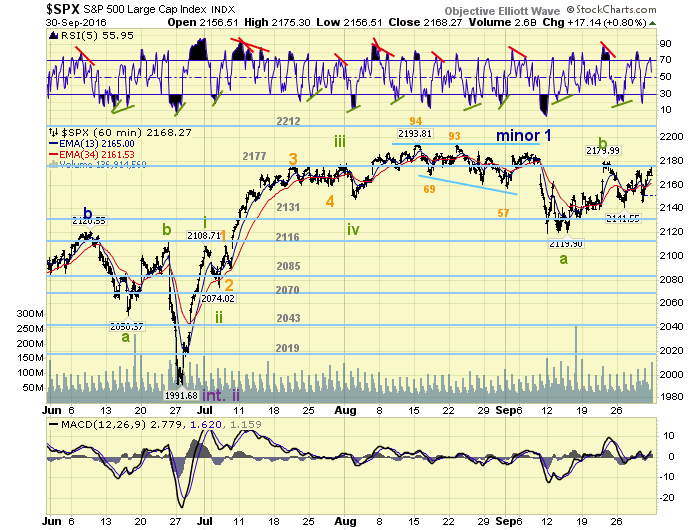
Overall it appears the market may be just marking time until earnings season approaches. Short term support is at SPX 2142 and the 2131 pivot, with resistance at the 2177 pivot and SPX 2194. Short term momentum ended the week just above neutral.
FOREIGN MARKETS
Asian markets were mostly lower on the week losing 0.9%.
European markets were all lower losing 0.9% as well.
The Commodity equity group were mixed losing 0.2%.
The DJ World index lost 0.4% on the week.
COMMODITIES
Bonds continue to downtrend and lost 0.2% on the week.
Crude is in an uptrend and gained 8.5% on the week.
Gold is in a choppy uptrend and lost 1.8% on the week.
The USD is in a choppy uptrend and finished flat on the week.
NEXT WEEK
Monday: ISM, construction spending and auto sales at 10am. Tuesday: the ECB meets. Wednesday: the ADP, trade deficit, factory orders and ISM services. Thursday: weekly jobless claims. Friday: monthly Payrolls (est. +183K), wholesale inventories and consumer credit. Best to your weekend and week!
CHARTS: http://stockcharts.com/public/1269446/tenpp
After about 40 years of investing in the markets one learns that the markets are constantly changing, not only in price, but in what drives the markets. In the 1960s, the Nifty Fifty were the leaders of the stock market. In the 1970s, stock selection using Technical Analysis was important, as the market stayed with a trading range for the entire decade. In the 1980s, the market finally broke out of it doldrums, as the DOW broke through 1100 in 1982, and launched the greatest bull market on record.
Sharing is an important aspect of a life. Over 100 people have joined our group, from all walks of life, covering twenty three countries across the globe. It's been the most fun I have ever had in the market. Sharing uncommon knowledge, with investors. In hope of aiding them in finding their financial independence.
Copyright © 2016 Tony Caldaro - All Rights Reserved Disclaimer: The above is a matter of opinion provided for general information purposes only and is not intended as investment advice. Information and analysis above are derived from sources and utilising methods believed to be reliable, but we cannot accept responsibility for any losses you may incur as a result of this analysis. Individuals should consult with their personal financial advisors.
Tony Caldaro Archive |
© 2005-2022 http://www.MarketOracle.co.uk - The Market Oracle is a FREE Daily Financial Markets Analysis & Forecasting online publication.