This Ratio Suggests Gold Is Entering a Major Bull Market
Commodities / Gold and Silver 2017 Jan 22, 2017 - 02:08 PM GMTBy: John_Mauldin
An often cited negative about gold is the inability for investors to value it, unlike traditional investments such as stocks and bonds.
A company’s revenues and earnings can be forecast to arrive at a valuation multiple. A bond’s cash flows can be discounted to come up with a present value. But since gold bullion does not produce either, investors often struggle with assigning a fair value.
Some will look at technical analysis, others fundamentals, interest rates, or expected inflation—but unfortunately there’s no correct answer, and attempting to time the market when choosing an entry point is extremely difficult.
Evaluating Gold’s Value
There is one long-term indicator an investor can monitor when reviewing portfolio allocations and initiating a position in physical gold bullion.
It’s the S&P 500 to gold ratio.
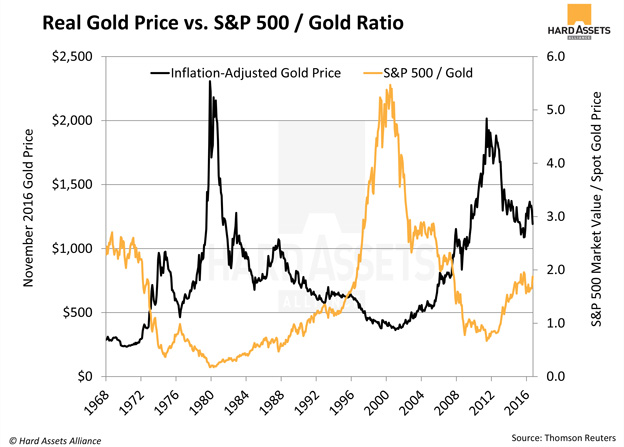
This is simply the amount of gold, expressed in ounces, equal to the level of the S&P 500. Below is the ratio and real gold price since 1968.

As you can see, the ratio has varied widely with a low of .17 in 1980, when gold reached an inflation adjusted high of $2100/oz., to over 5 at the height of the tech boom in late 1990s, when gold was trading around $400/oz. Currently the ratio is 1.90, 21% above its historical average of 1.57.
Using the Ratio
Since 1970, each time the ratio has been around 2, gold turned out to be a very good investment. There have been two such instances since 1970 and each time resulted in large gains. We’re potentially facing a third right now.
- In June of 1970, with the reading at 2.03, an investor would have purchased gold at $235/oz. By November 1974, gold was trading at $970/oz., and by the summer of 1980, gold was over $2,000/oz. This translates into a cumulative gain of almost 800%, or 24.5% annually.
- The second instance occurred in November 1996, with gold trading at $570/oz. and a ratio of 2.04. The internet bubble of the late 1990s drove stocks—including those in the S&P 500—to extreme valuations, so the ratio soared to over 5. But if an investor had the patience to hold, the return far outpaced the stock market for the next decade. Gold went from an inflation-adjusted $570/oz. in 1996, to $800 in early 2006, and then onto $1,940/oz. in August 2011, representing a gain of 240% (8.8% annually). During this same time, the S&P 500 had a total return of 52%, or 2.9% annually.
Since market timing is very difficult, it’s generally more advantageous to risk being early and leaving some profit on the table than trying to squeeze every percentage return from an investment.
Third Time’s a Charm?
Whether it’s financial risks from a fracturing European Union, slowing China, an emerging market, political uncertainty in the US, or excessive market valuations, now is the time to examine your portfolio and consider adding the insurance only physical gold bullion can offer.
Investors who think the current eight-year bull market has room to run may benefit by waiting for the ratio to rise above two—but keep in mind PE of the S&P 500 in 1999–2000 was near 30, about twice its historical average of 16. Currently around 23 (depending on the growth rate you assign to earnings) it appears stocks are fully valued.
While the S&P 500/gold ratio is not excessive (as it was in the late 1990s), it is at a 10-year high, and we’re in a different market environment and economic climate.
Investors concerned about principal and purchasing power preservation should consider this longer-term trend when examining their portfolios and the diversification benefits of gold.
Free Ebook: Investing in Precious Metals 101: How to buy and store physical gold and silver
Download Investing in Precious Metals 101 for everything you need to know before buying gold and silver. Learn how to make asset correlation work for you, how to buy metal (plus how much you need), and which type of gold makes for the safest investment. You’ll also get tips for finding a dealer you can trust and discover what professional storage offers that the banking system can’t. It’s the definitive guide for investors new to the precious metals market. Get it now.
John Mauldin Archive |
© 2005-2022 http://www.MarketOracle.co.uk - The Market Oracle is a FREE Daily Financial Markets Analysis & Forecasting online publication.


