


Does CoT Show Battle over Gold?
Commodities / Gold and Silver 2018 Jan 16, 2018 - 09:42 PM GMTBy: Arkadiusz_Sieron

 The Commodity Futures Trading Commission has released the latest CoT report. What can we learn from it about the gold market?
Light and Darkness in the Gold Market
The epic battle between good and evil. The conflict between light and darkness. We and them. This is how some analysts portray the Commitments of Traders report. Commercials, i.e. bullion banks such as JP Morgan, are of course the bad guys.
But wait, what’s all this about? As we explained in our Dictionary, the Commitments of Traders Report, also known as the CoT or COT report, is one of the most widely analyzed publications in the U.S. futures market, including the gold market. It provides investors with a breakdown of open interest positions (i.e., the total number of futures contracts not yet liquidated by an offsetting transaction or fulfilled by delivery) of all major contracts that have more than 20 traders. It is a valuable publication. However, this weekly report contains Tuesday’s data, but it is issued on Friday with a three day lag. Let’s analyze now the most recent publication.
Gold Positions as of January 9, 2018
The chart below shows the gold futures and options combined traded at Comex. It indicates that non-commercials (speculators) were net long and tended to follow gold prices, while commercials were net short and generally moved in the opposite direction to the gold prices.
Chart 1: Gold prices (yellow line, right axis, London P.M. fixing, in $), the net position of commercials (green line, left axis) and the net position of non-commercials (red line, left axis) over the last 12 months (aggregate version, futures and options combined).
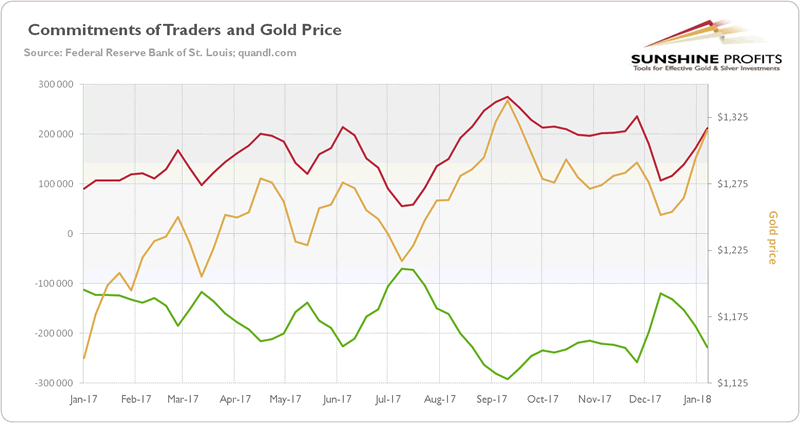
It makes perfect sense, as the commercials’ position is effectively just the mathematical offset of the non-commercials’ position. Both players are like two sides of the coin. Speculators cannot be net long, unless commercial go net short. Yin and yang.
As you can see in the chart, non-commercials drive the process, as their net position usually moves in the same direction as the gold prices. So investors can use this data as a sentiment indicator in the gold market (but using it as a timing indicator and detecting if the market is too bullish or too bearish, is a different matter). Both of them started to decline in September, but they rebounded in December and continued rally in January. At the same time, commercials strengthened their net short position. We see that the current positions are within historical limits, i.e. in September they were higher. Hence, the current trend has still some room to persist. In other words, if market sentiment does not change, the gold price rally will continue.
Conclusion
The latest Commitment of Traders (COT) report showed another rise in speculative net long position for the fourth straight week. They increased by 40,000 contracts from the previous week, which is quite impressive, but not unusual. And it’s not a very long series of increases and there is still a long way to the all-time net-long position high of 348,000 contracts achieved in July 2016. Hence, the rally in gold prices may continue for a while, especially if the weakness in the U.S. dollar persists. Having said this, investors should remember that the net positions are able to change quickly – especially that the report comes out with the lag. The CoT report is thus a sentiment indicator, which can picture the market’ attitude, but it shouldn’t be used as a timing indicator. Last but not least, there are many analysis which suggest that commercials manipulate the gold market, as they are almost all the time net short. Well, it may be the case (some conspiracy theories proved to be correct after some time) – but investors should remember that trade has always two sides. Speculators cannot be long, if commercials don’t take short positions. Yin and yang.
If you enjoyed the above analysis, we invite you to check out our other services. We focus on fundamental analysis in our monthly Market Overview reports and we provide daily Gold & Silver Trading Alerts with clear buy and sell signals. If you’re not ready to subscribe yet and are not on our gold mailing list yet, we urge you to sign up. It’s free and if you don’t like it, you can easily unsubscribe. Sign up today.
Disclaimer: Please note that the aim of the above analysis is to discuss the likely long-term impact of the featured phenomenon on the price of gold and this analysis does not indicate (nor does it aim to do so) whether gold is likely to move higher or lower in the short- or medium term. In order to determine the latter, many additional factors need to be considered (i.e. sentiment, chart patterns, cycles, indicators, ratios, self-similar patterns and more) and we are taking them into account (and discussing the short- and medium-term outlook) in our trading alerts.
Thank you.
If you enjoyed the above analysis and would you like to know more about the gold ETFs and their impact on gold price, we invite you to read the April Market Overview report. If you're interested in the detailed price analysis and price projections with targets, we invite you to sign up for our Gold & Silver Trading Alerts . If you're not ready to subscribe at this time, we invite you to sign up for our gold newsletter and stay up-to-date with our latest free articles. It's free and you can unsubscribe anytime.
Arkadiusz Sieron
Sunshine Profits‘ Market Overview Editor
Disclaimer
All essays, research and information found above represent analyses and opinions of Przemyslaw Radomski, CFA and Sunshine Profits' associates only. As such, it may prove wrong and be a subject to change without notice. Opinions and analyses were based on data available to authors of respective essays at the time of writing. Although the information provided above is based on careful research and sources that are believed to be accurate, Przemyslaw Radomski, CFA and his associates do not guarantee the accuracy or thoroughness of the data or information reported. The opinions published above are neither an offer nor a recommendation to purchase or sell any securities. Mr. Radomski is not a Registered Securities Advisor. By reading Przemyslaw Radomski's, CFA reports you fully agree that he will not be held responsible or liable for any decisions you make regarding any information provided in these reports. Investing, trading and speculation in any financial markets may involve high risk of loss. Przemyslaw Radomski, CFA, Sunshine Profits' employees and affiliates as well as members of their families may have a short or long position in any securities, including those mentioned in any of the reports or essays, and may make additional purchases and/or sales of those securities without notice.
Arkadiusz Sieron Archive |
© 2005-2022 http://www.MarketOracle.co.uk - The Market Oracle is a FREE Daily Financial Markets Analysis & Forecasting online publication.