


Pay Attention To The Russell Stocks Index and Financial Sectors
Stock-Markets / Stock Markets 2019 Jan 20, 2019 - 07:30 PM GMTBy: Chris_Vermeulen

 For those that still believe the US markets are weak and poised for a total collapse, we want to bring something to your attention. Throughout weeks of uncertainty about China trade deals, the US government shutdown, continued Brexit issues and who knows what else… oh yeah US Q4 Earnings data, guess what has been taking place in some US sectors? That’s right, a rather solid price recovery.
Two of our favorite sectors to watch for signs of strength and weakness have been rocketing higher over the past few weeks after setting up a very deep price low near Christmas 2018. The Russell 2000 ETF (IWM) and the Financial Sector ETF (XLF). While the ES, NQ, and others are still waffling around trying to find the momentum to break out to the upside, pay attention to the other sectors that could be leading the way.
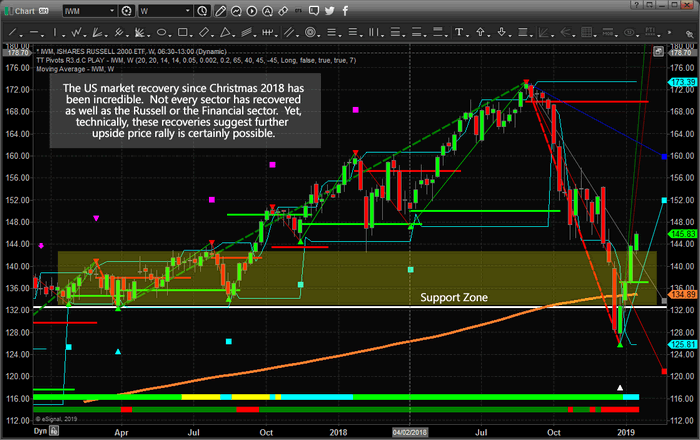
Weekly IWM (Russell 2000) Chart
This first Weekly IWM (Russell 2000) chart clearly shows the support zone that was set up in early 2018 after the February 2018 price collapse. Yes, the recent October 2018 price collapse drove price below that support level, but it appears this is a “wash-out” low price reversal where traders panicked on the news and other events. The fact that this recovery has taken place may cause some to consider this a “dead-cat-bounce”, but we’re not seeing that in our research. This could/should be the start of something that pushes prices sideways/higher for a few months, at which time we will need to see to these sectors and the rest of the markets are performing to determine if the overall market is still I a bull market or about to drop into its first bear market leg down.
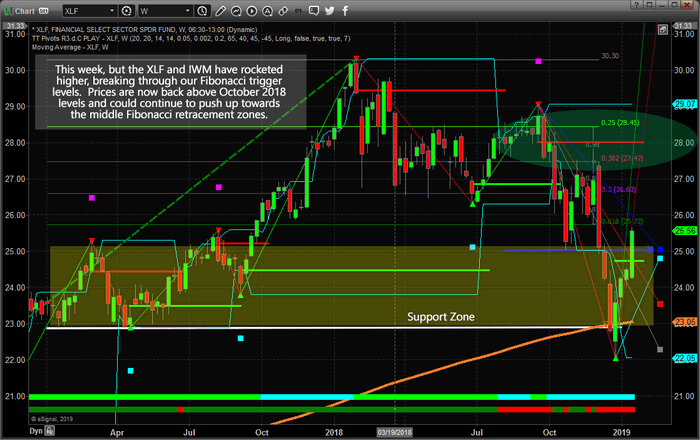
Weekly XLF (Financial Sector) Chart
This next chart is a Weekly XLF (Financial Sector) ETF showing our Fibonacci price modeling system and a similar Support Zone. One thing that is rather interesting about these charts is that they are both moving substantially higher this week while recently breaking above our Fibonacci bullish trigger level (shown near the right side of the chart as a GREEN LINE). The XLF chart also shows that the current price is well above the BLUE and CYAN Fibonacci projected target levels. This indicates that price may be attempting to move back into the earlier Fibonacci price range (retracement range) to establish more rotation. This new price rotation will set up new Fibonacci modeling system trigger points and tell us where the next move is likely to target.
Yes, we do expect some downside rotation near current levels. We don’t expect this rotation to be very deep or concerning. Price must move in waves, up and down, to support future momentum higher or lower. Our Fibonacci modeling system is suggesting any current downside rotation will likely result in a new momentum move to the upside. Still, these sectors are on fire right now and we urge traders to be cautious of any longs because we are expecting some downside price rotation over the next week or two before the next rally.
Pay attention to these markets moves. 2019 is poised to be a very exciting and profitable year for skilled traders and wise investors. Visit www.TheTechnicalTraders.com to get our daily and weekly analysis forecast complete with long term investing swing trading, and index day trade signals.
53 years experience in researching and trading makes analyzing the complex and ever-changing financial markets a natural process. We have a simple and highly effective way to provide our customers with the most convenient, accurate, and timely market forecasts available today. Our index, stock and ETF trading alerts are readily available through our exclusive membership service via email and SMS text. Our newsletter, Technical Trading Mastery book, and 3 Hour Trading Video Course are designed for both traders and investors. Also, some of our strategies have been fully automated for the ultimate trading experience.
Chris Vermeulen
www.TheTechnicalTraders.com
Chris Vermeulen has been involved in the markets since 1997 and is the founder of Technical Traders Ltd. He is an internationally recognized technical analyst, trader, and is the author of the book: 7 Steps to Win With Logic
Through years of research, trading and helping individual traders around the world. He learned that many traders have great trading ideas, but they lack one thing, they struggle to execute trades in a systematic way for consistent results. Chris helps educate traders with a three-hour video course that can change your trading results for the better.
His mission is to help his clients boost their trading performance while reducing market exposure and portfolio volatility.
He is a regular speaker on HoweStreet.com, and the FinancialSurvivorNetwork radio shows. Chris was also featured on the cover of AmalgaTrader Magazine, and contributes articles to several leading financial hubs like MarketOracle.co.uk
Disclaimer: Nothing in this report should be construed as a solicitation to buy or sell any securities mentioned. Technical Traders Ltd., its owners and the author of this report are not registered broker-dealers or financial advisors. Before investing in any securities, you should consult with your financial advisor and a registered broker-dealer. Never make an investment based solely on what you read in an online or printed report, including this report, especially if the investment involves a small, thinly-traded company that isn’t well known. Technical Traders Ltd. and the author of this report has been paid by Cardiff Energy Corp. In addition, the author owns shares of Cardiff Energy Corp. and would also benefit from volume and price appreciation of its stock. The information provided here within should not be construed as a financial analysis but rather as an advertisement. The author’s views and opinions regarding the companies featured in reports are his own views and are based on information that he has researched independently and has received, which the author assumes to be reliable. Technical Traders Ltd. and the author of this report do not guarantee the accuracy, completeness, or usefulness of any content of this report, nor its fitness for any particular purpose. Lastly, the author does not guarantee that any of the companies mentioned in the reports will perform as expected, and any comparisons made to other companies may not be valid or come into effect.
Chris Vermeulen Archive |
© 2005-2022 http://www.MarketOracle.co.uk - The Market Oracle is a FREE Daily Financial Markets Analysis & Forecasting online publication.