


Is Widening Yield Curve Inversion Lifting Gold Prices Up?
Commodities / Gold & Silver 2019 Aug 15, 2019 - 07:06 PM GMTBy: Arkadiusz_Sieron

 The yield curve inversion just got more pronounced. Not only the spread between 10-year and 3-month Treasuries, now also the spread between 10-year and 2-year turned negative. That sends a warning signal about the state of the real economy. About a recession on the horizon. Some might argue that the yield curve’s predictive power has diminished with all the unorthodox monetary policies since the Great Recession. Yet, it’s a valid reason to worry – how does gold welcome this message?
Inversion Gets Wider
The U.S. Treasury yield curve inversion is getting wider. We have been reporting on the inverted yield curve since May, when the spread between the 10-year and 3-month debt instruments turned negative. Now, the spread between the 10-year and 2-year Treasuries joined the infamous club. Please take a look at the chart below.
Chart 1: Spread between 10-year and 3-month Treasuries (red line) and between 10-year and 2-year Treasuries (green line) in 2019.
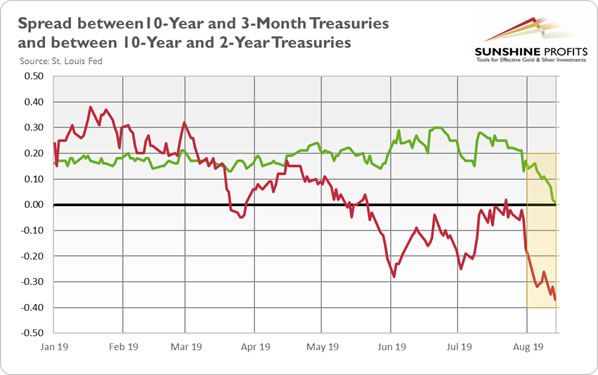
The daily data does not reveal the inversion, but the difference between 10-year and 2-year bonds temporarily fell to a negative 1 basis point on Wednesday. The chart shows that this spread plunged to 0.01 percent and that a permanent inversion is only a matter of time. What this chart also presents is that the spread between 10-year and 3-month Treasuries got even bigger, diving below negative 0.35.
This is all very disturbing. The inversion of the 10-Year/2-Year spread strengthens the recessionary signal sent earlier by the inversion of the 10-year/3-Month spread. The inversion of one spread could be caused by some specific or peculiar factors, but the inversion of two spreads excludes any random factors, which means that the situation is turning really grave. Inversions in crucial segments of the yield curve have almost always preceded recessions. Fundamentally, it’s great news for the gold bulls, as investors who believe an inverted yield curve is a bad omen for the economy may reach for precious metals.
Not surprisingly, the yesterday’s inversion created a selling frenzy in U.S. equities, just one day after the U.S. eased its stance in a trade war against China. The Dow Jones plunged 800 points, or 3 percent. The price of gold rose, confirming its safe-haven status, although the upward move was a bit timid, given the big drop in the stock market. It may signal that more downside action in the short run. On Tuesday, after the U.S. softened its stance on trade war, the price of gold plunged $40 in just half an hour. On balance however, the array of fundamental factors provides a tailwind for gold.
The inversion of the yield curve has also spurred President Trump to take to Twitter, blaming the Fed for all the evils and strengthening the pressure on Powell:
Spread is way too much as other countries say THANK YOU to clueless Jay Powell and the Federal Reserve. Germany, and many others, are playing the game! CRAZY INVERTED YIELD CURVE! We should easily be reaping big Rewards & Gains, but the Fed is holding us back. We will Win!
Implications for Gold
Implications for gold are clear. The inversion of the yield curve is an important recessionary signal. Actually, it is one of the most reliable harbingers of upcoming downturn. Recessions means risk aversion and strengthen safe-haven demand for gold. In a response to an economic slump, the central bank is expected to provide a fresh monetary accommodation, slashing interest rates. Low and falling bond yields work to make the yellow metal a more attractive investment than a positive real interest rate environment does.
The scary truth is that the total value of negative yielding bonds around the world has hit $16 trillion, or more than 25 percent of the market. The simple math indicates that it’s better to own gold that yields nothing than to hold governments bonds that yield negative. The more negative yields rise to prominence, the brighter the shine of gold. Indeed, the current gains in gold happened despite the dollar’s strength. Gold prices expressed in several other currencies have reached multi-year heights. So it’s scary to think how gold would perform in the absence of a strong dollar. The decline in American real interest rates – the yield on 10-year inflation indexed Treasuries has fallen recently almost to zero – that works to dent the appeal of the greenback, taking away one more headwind from the gold price.
If you enjoyed the above analysis, we invite you to check out our other services. We provide detailed fundamental analyses of the gold market in our monthly Gold Market Overview reports and we provide daily Gold & Silver Trading Alerts with clear buy and sell signals. If you’re not ready to subscribe yet and are not on our gold mailing list yet, we urge you to sign up. It’s free and if you don’t like it, you can easily unsubscribe. Sign up today!
Arkadiusz Sieron
Sunshine Profits‘ Market Overview Editor
Disclaimer
All essays, research and information found above represent analyses and opinions of Przemyslaw Radomski, CFA and Sunshine Profits' associates only. As such, it may prove wrong and be a subject to change without notice. Opinions and analyses were based on data available to authors of respective essays at the time of writing. Although the information provided above is based on careful research and sources that are believed to be accurate, Przemyslaw Radomski, CFA and his associates do not guarantee the accuracy or thoroughness of the data or information reported. The opinions published above are neither an offer nor a recommendation to purchase or sell any securities. Mr. Radomski is not a Registered Securities Advisor. By reading Przemyslaw Radomski's, CFA reports you fully agree that he will not be held responsible or liable for any decisions you make regarding any information provided in these reports. Investing, trading and speculation in any financial markets may involve high risk of loss. Przemyslaw Radomski, CFA, Sunshine Profits' employees and affiliates as well as members of their families may have a short or long position in any securities, including those mentioned in any of the reports or essays, and may make additional purchases and/or sales of those securities without notice.
Arkadiusz Sieron Archive |
© 2005-2022 http://www.MarketOracle.co.uk - The Market Oracle is a FREE Daily Financial Markets Analysis & Forecasting online publication.