


Long Term Cycles Suggest Stock Price Reversion Pending & Gold Price About To Explode High
Stock-Markets / Financial Markets 2020 Oct 08, 2020 - 04:57 PM GMTBy: Chris_Vermeulen

RESEARCH HIGHLIGHTS:
- In the early 1900s, multiple events prompted a rising commodity price level and a decline in the Stocks to Commodities ratio. We expect commodities may begin to appreciate and where stock price levels may stall or decline.
- We also believe we are currently nearing the end of a rising cycle in both Stocks to Commodities and S&P500 to Earnings ratios, suggesting a downward/sideways trend in the US stock market will continue while commodities attempt to form a longer-term momentum base.
- The current 100-year Gold cycle suggests a Recovery phase is nearly complete and we should expect an Appreciation phase to begin within 2 years (or less). Historically, the Appreciation phase prompts a 200% to 300%+ rally in Gold prices.
My research team and I have been pouring over the long-term data related to the current global markets and central bank efforts to support the global economy in the midst of the COVID-19 pandemic… and we have some keen insights I would like to share with you. This research article highlights historical chart phases and trends and shows you how important it is to pay attention to cycles and Super-Cycle events as they continue to trend.
US STOCKS TO COMMODITIES RATIO CHART PHASES
In the early 1900s, multiple events prompted a rising commodity price level and a decline in the Stocks to Commodities ratio. The continued industrialization of the US as well as the demand for commodities as “maker industries” flourished in the early 1900s prompted a decline in the Stocks to Commodities ratio. The start of WWI (1914 – 1918) prompted a strong downtrend in the Stocks to Commodities ratio, eventually settling near a bottom in June 1920. Even the Spanish Flu added to the demand for commodities as consumers still needed basic commodities to survive.
At that time in economic cycles, stock price levels began to collapse in comparison to commodity prices. We can clearly see the downtrend in the long-term Stocks to Commodities Ratio chart below. Pay very close attention to how the downtrend lasted from early 1907 to 1921. When the Stocks to Commodities ratio declines in value, we typically see a rising commodities price level compared to a declining or stalling stock price level. When the Stocks to Commodities ratio rises, this represents a declining commodities price level to a rising or stable stock price level.
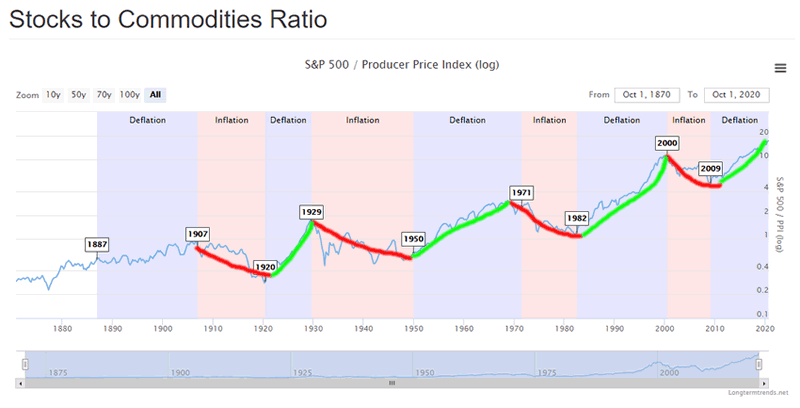
We are currently in an upward Stocks to Commodities ratio cycle – which suggests commodities are decreasing in value while stocks are increasing in value. We believe this cycle may be nearing an end (within the next few years) where commodities may begin to appreciate and where stock price levels may stall or decline.
Before you continue, be sure to opt-in to our free-market trend signals now so you don’t miss our next special report!
The COVID-19 virus event may present a similar downtrend in US stock price levels as we may have experienced with the Spanish Flu in 1918 – pushing the current rising trend into a declining trend. The cycle of demand for commodities becomes dependent on consumer and industrial demand cycles. Currently, we believe the demand level for raw commodities is diminishing considerably as the global economy reverberates because of the COVID-19 shutdowns.
S&P 500 PRICE TO EARNINGS RATIO CHART PHASES
When we take a look at the longer-term S&P500 Price to Earnings Ratio chart below, we see similar trends that somewhat align with the Stocks to Commodities Ratio chart. The first downward Earnings trend peaked near 1896 and bottomed near 1919 (below). The second downward Earnings trend peaked near 1934 and bottomed near 1952. Using a simple “by eye” comparison across these two charts, it appears the peak in the Earnings charts originated about 2~3 years before the peak in the Stock to Commodities peaks and the bottoms in these cycles aligned within a 1~2 year range.
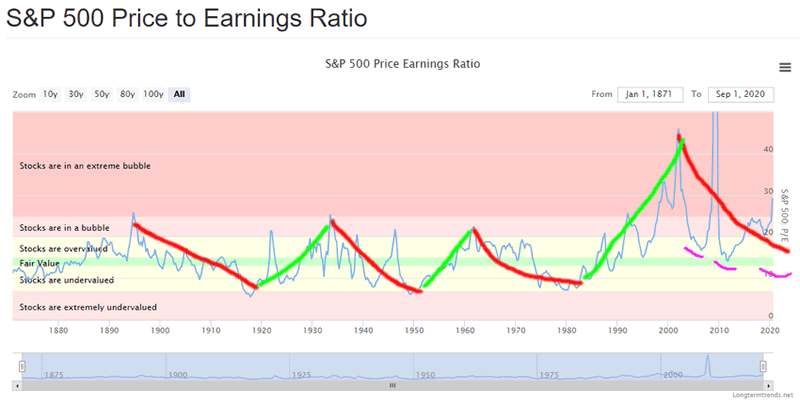
Our research team believes we are currently nearing the end of a rising cycle in both Stocks to Commodities and S&P500 to Earnings ratios. We believe the final phase of this advance will look somewhat like 1933 to 1952 declining cycle where stock and commodities attempt to find a base level (we call fair market value). We believe the Excess Phase in the US stock market has contracted over the past 25+ days as an exhaustion peak. If this trend continues, we believe a downward/sideways trend in the US stock market will continue while commodities attempt to form a longer-term momentum base (possibly lasting 24+ months) before bottoming.
100 YEAR GOLD CHART PHASES
The 100 year Gold chart below highlights the unique phases showing how Gold reacts to the broader market cycle phases we’ve highlighted above. Gold, being a safe-haven commodity, reacts in similar cycle phases (excluding the 1971 Exit from the Gold Standard phase). You can clearly see the three phases we’ve highlighted in the chart below roughly align with the cycle phases and trends in the Commodities Ratio charts seen above. The primary difference is that Gold enters a Recovery Phase early in the organic economic growth phases of the Commodity cycles and is somewhat immune to the S&P Price to Earnings phases.
Notice how Gold began Recovery Phases in 1922, 1971 and 2004? Now, take a look at the Stocks to Commodities Ratio bottoms in the cycles: 1920, 1950, 1982, and 2009. As you can see, there is alignment with the exception of the 1950 and 1982 cycle bottoms. This can easily be explained as a process of the institution of the US Federal Reserve (1933) and the removal of the Gold Standard (1971). When we discount these dramatic alterations to the organic cycles, we can see that Gold reacted to the ending of the Gold Standard with a huge Recovery and Appreciation phase.
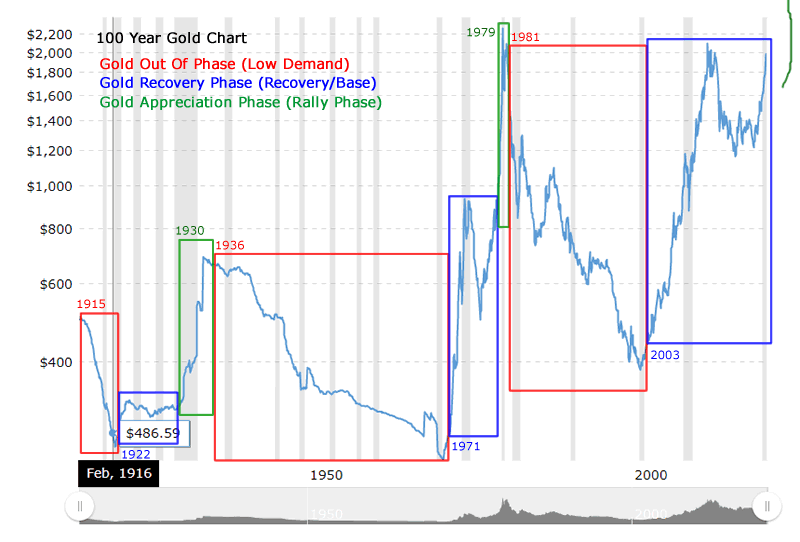
The current cycle suggests a Recovery phase is nearly complete and we should expect an Appreciation phase to begin within 2 years (or less). Historically, the Appreciation phase prompts a 200% to 300%+ rally in Gold prices – this time the rally may be even greater. We are just waiting for confirmation that the upward cycle in Stocks to Commodities and S&P Price to Earnings ratios have peaked and begin to move lower. That cycle confirmation will suggest the Recovery phase in Gold has ended and the Appreciation phase has begun. Additionally, once Gold rallies above $2,200 (breaking recent highs), this could also be considered a confirmation of the new Appreciation Phase in Gold.
This article illustrates that longer-term economic cycles play a very big role in how we, as technical traders, attempt to identify opportunities and trends. The theory that Technical Analysis is the study of indicators and price theory fails to address the fact that many aspects of cycles, trends, appreciation/depreciation, theory, indicators, and other factors go into our analysis. We use Technical analysis as a final confirmation tool and as a primary source for our research, but we rely on cycles, historical data, nuanced patterns and so much more to try to help traders find and execute better trades.
Traders should be ready for wild volatility over the next 2~3+ years and a very strong potential that commodity prices (particularly Gold and Silver) will transition into the Appreciation Phase fairly soon. I have been following Gold and Silver for years now and have many of the Gold industry giants following my precious metals research. I walk through the precious metals, miners, and junior miners charts several times a week in my pre-market video report delivered every morning to Technical Trader subscribers.
Isn’t it time you learned how I can help you better understand technical analysis as well as find and execute better trades? If you look back at past research, you will see that my incredible team and our proprietary technical analysis tools have shown you what to expect from the markets in the future. Do you want to learn how to profit from these expected moves? If so, sign up for my Active ETF Swing Trade Signals today!
If you have a buy-and-hold or retirement account and are looking for long-term technical signals for when to buy and sell equities, bonds, precious metals, or sit in cash then be sure to subscribe to my Passive Long-Term ETF Investing Signals to stay ahead of the market and protect your wealth!
Chris Vermeulen
www.TheTechnicalTraders.com
Chris Vermeulen has been involved in the markets since 1997 and is the founder of Technical Traders Ltd. He is an internationally recognized technical analyst, trader, and is the author of the book: 7 Steps to Win With Logic
Through years of research, trading and helping individual traders around the world. He learned that many traders have great trading ideas, but they lack one thing, they struggle to execute trades in a systematic way for consistent results. Chris helps educate traders with a three-hour video course that can change your trading results for the better.
His mission is to help his clients boost their trading performance while reducing market exposure and portfolio volatility.
He is a regular speaker on HoweStreet.com, and the FinancialSurvivorNetwork radio shows. Chris was also featured on the cover of AmalgaTrader Magazine, and contributes articles to several leading financial hubs like MarketOracle.co.uk
Disclaimer: Nothing in this report should be construed as a solicitation to buy or sell any securities mentioned. Technical Traders Ltd., its owners and the author of this report are not registered broker-dealers or financial advisors. Before investing in any securities, you should consult with your financial advisor and a registered broker-dealer. Never make an investment based solely on what you read in an online or printed report, including this report, especially if the investment involves a small, thinly-traded company that isn’t well known. Technical Traders Ltd. and the author of this report has been paid by Cardiff Energy Corp. In addition, the author owns shares of Cardiff Energy Corp. and would also benefit from volume and price appreciation of its stock. The information provided here within should not be construed as a financial analysis but rather as an advertisement. The author’s views and opinions regarding the companies featured in reports are his own views and are based on information that he has researched independently and has received, which the author assumes to be reliable. Technical Traders Ltd. and the author of this report do not guarantee the accuracy, completeness, or usefulness of any content of this report, nor its fitness for any particular purpose. Lastly, the author does not guarantee that any of the companies mentioned in the reports will perform as expected, and any comparisons made to other companies may not be valid or come into effect.
Chris Vermeulen Archive |
© 2005-2022 http://www.MarketOracle.co.uk - The Market Oracle is a FREE Daily Financial Markets Analysis & Forecasting online publication.