


The Top 10 Stocks that Institutional Investors are Selling
Stock-Markets / Stocks Bear Market Oct 24, 2008 - 02:03 PM GMTBy: Marty_Chenard

What have the Institutional Investors been doing on the "core holdings"?
Which stocks are they Selling off and rotating out of?
On October 10th. the market hit a low and then moved up. At that time, we tracked the percentage of how much each of the Institutional core holding stocks were in their aggregate portfolios.
We then tracked the percentage change in Accumulation or Distribution for each of their top 75 core holdings. This special report shows you the trending for the top 10 with increased Accumulation, and the bottom 10 with increased Distribution.
This study shows investors which stocks Institutions feel are the safest and worthy of buying more. On the flip side, it also shows which stocks Institutions feel are the riskiest and should be sold. For those looking for individual stock ideas, this presents a good overview of what to consider and what to avoid.
Today, we will share the Bottom 10 stocks that Institutions are selling off on their "core holdings" portfolio .
The Institutional Bottom 10 stock in Distribution ...
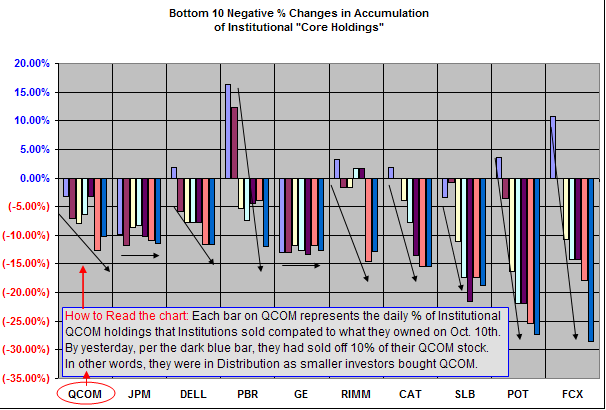
Below are the Bottom 10 stocks that Institutions have been selling off or reducing exposure on since October 10th. See the Chart below.
The chart data starts on October 10th. and moves forward on a daily basis. Each bar represents the percent decrease in the amount of stock owned by Institutions for each stock listed from October 10th. forward. These stocks are high risk investments being sold off by Institutions as other investors are buying them.
The arrows show the percentage daily drop direction on the dollar amount of holdings they carry on these stocks. These stocks are in distribution by Institutional Investors.
(For those who feel this information is of importance to them ... "On our paid subscriber site today, we also posted the Top 10 Institutional "core holding" stocks in Accumulation ... these are important, because they will be the strongest Institutionally supported stocks when the market finally has an upside rally. On tomorrow's paid subscriber site, we will also post the remaining top 55 Institutional "core holding" stocks and what Institutions have been doing with them. This is a Special Report, not an ongoing event. It took many hours to compile all this data and it is NOT something I can do on an ongoing basis ... however, I will post it again in the future as time permits.")
______________________________________________________________________
*** Feel free to share this page with others by using the "Send this Page to a Friend" link below.
By Marty Chenard
http://www.stocktiming.com/
Please Note: We do not issue Buy or Sell timing recommendations on these Free daily update pages . I hope you understand, that in fairness, our Buy/Sell recommendations and advanced market Models are only available to our paid subscribers on a password required basis. Membership information
Marty Chenard is the Author and Teacher of two Seminar Courses on "Advanced Technical Analysis Investing", Mr. Chenard has been investing for over 30 years. In 2001 when the NASDAQ dropped 24.5%, his personal investment performance for the year was a gain of 57.428%. He is an Advanced Stock Market Technical Analyst that has developed his own proprietary analytical tools. As a result, he was out of the market two weeks before the 1987 Crash in the most recent Bear Market he faxed his Members in March 2000 telling them all to SELL. He is an advanced technical analyst and not an investment advisor, nor a securities broker.
Marty Chenard Archive |
© 2005-2022 http://www.MarketOracle.co.uk - The Market Oracle is a FREE Daily Financial Markets Analysis & Forecasting online publication.