


Inflation pushes the 30-year Treasury bond yield through long-term moving average trends!
Interest-Rates / US Bonds Apr 16, 2022 - 02:14 PM GMTBy: Gary_Tanashian

Okay, let’s take a breath. I don’t like to use ‘!’ in titles or even in articles. In fact, when I see too many of them I immediately think that someone really REALLY wants me to see their point. That said, the signal shown below is pretty important.
It’s in-month with a monstrously over-bearish bond sentiment backdrop similar to when we installed a red arrow on the chart below at the height of the Q1 2011 frenzy (cue the Bond King: “short the long bond!”). Chart jockeys are probably delivering the bad news of the chart’s inverted H&S, a potential for which NFTRH began managing a year ago when the 30yr yield hit our initial target of 2.5% and then recoiled as expected after the public became very concerned about inflation.
But we were planning for the possibility that the pullback could make a right side shoulder to a bullish pattern, and so it did. Now the question is whether the Continuum continues (resumes its long journey down) or does something it has not done for decades, which is to break the limiting moving average trends. It’s an important question states Captain Obvious.
The inflation hysteria a year ago was enough to foreshadow a contrary move in the other direction for inflation expectations (and the yield below). Larry was right; they had not seen anything yet. After a multi-month respite, now they see it (oh boy do they). They also see the Continuum (well, you and I do at least) piercing the limiters in a violent manner.
That is why this chart exists; to let us know if something that has been in place for decades (dis-inflationary backbone against which the Fed inflates the system as needed) will continue or give way to something new for the modern era but not entirely new historically, as Ludwig von Mises would advise. That would be a debt-triggered inflationary crack-up-boom or what I call Hellflation ©.
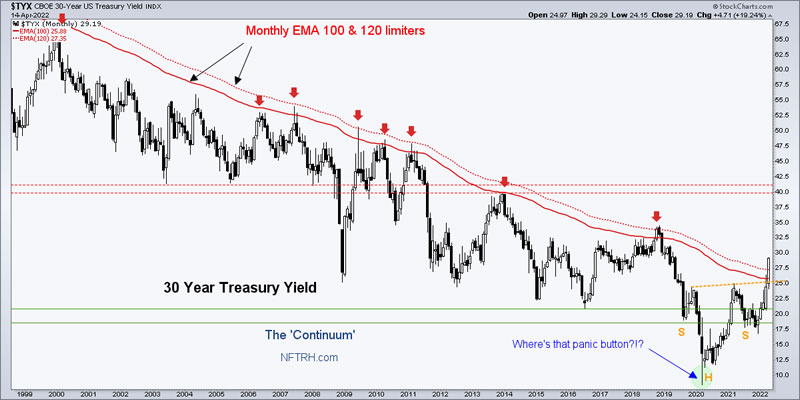
The inflation will not die easily. At whatever point inflation, its ‘expectations’ indicators and associated asset market trades make their highs we can expect a potentially dramatic pullback in the yield at some point. But if it does not pull back in the month of April (thereby flagging the monthly candle as a ‘reversal’ candle) the chances will increase that what has been for decades no longer will be.
That was a secular trend up in bonds and down in long-term yields. That was the very backbone of the inflated Keynesian economy against which policymakers have inflated boom cycles (most recently in Q1, 2020) and once again printed our way out of the inevitable bust cycles that have followed them. It’s a continuum, an ongoing game of hide the cheese (inflation). But the cheese is there in the form of all that debt that has not yet unwound.
You wonder why the Fed is flashing its Hawk eyes? A break of the secular downtrend in long-term yields (uptrend in the long bond) will change the game by which the Fed has been able to reflate the system literally at will during every economic and market bust crisis over the last couple of decades. It was a no-brainer (for dyed in the wool Keynesians at least) to manipulate and monetize bonds at every sign of trouble as long as bonds were not indicating a serious problem with the Fed’s primary tool, inflation. But if this and other indicators go on to make new secular trends ‘Houston, we have a problem’, and market participants have got to discard certain rule books.
For “best of breed” top down analysis of all major markets, subscribe to NFTRH Premium, which includes an in-depth weekly market report, detailed interim market updates and NFTRH+ dynamic updates and chart/trade setup ideas. You can also keep up to date with actionable public content at NFTRH.com by using the email form on the right sidebar. Follow via Twitter ;@NFTRHgt.
By Gary Tanashian
© 2022 Copyright Gary Tanashian - All Rights Reserved
Disclaimer: The above is a matter of opinion provided for general information purposes only and is not intended as investment advice. Information and analysis above are derived from sources and utilising methods believed to be reliable, but we cannot accept responsibility for any losses you may incur as a result of this analysis. Individuals should consult with their personal financial advisors.
Gary Tanashian Archive |
© 2005-2022 http://www.MarketOracle.co.uk - The Market Oracle is a FREE Daily Financial Markets Analysis & Forecasting online publication.