


Growth of Global Money Supply
Economics / Money Supply Jan 12, 2009 - 01:27 PM GMTBy: Mike_Hewitt

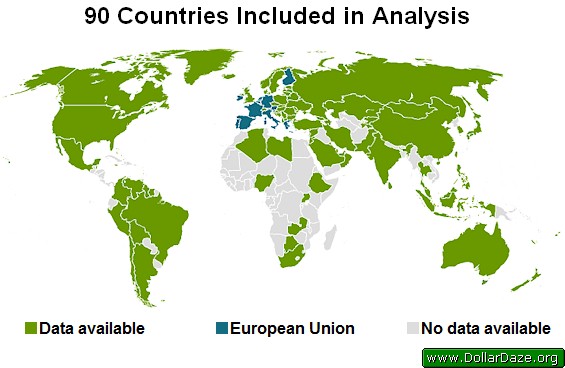
 This essay analyzes the growth of the money supply for 73 selected currencies from 90 countries. Nineteen of these countries belong to two monetary unions - the European Union and the East Caribbean Union. 1 Together, these countries make up 96.7% of the world's Gross Domestic Product (GDP) and 84.1% of the world's population . 2
There are several different monetary aggregates used to measure a nation's money supply. These monetary aggregates can be thought of as forming a continuum from most liquid (money as a means of exchange) to least liquid (money as a store of value). 3
The measures, while not completely consistent across different countries, may be generalized as follows: 4
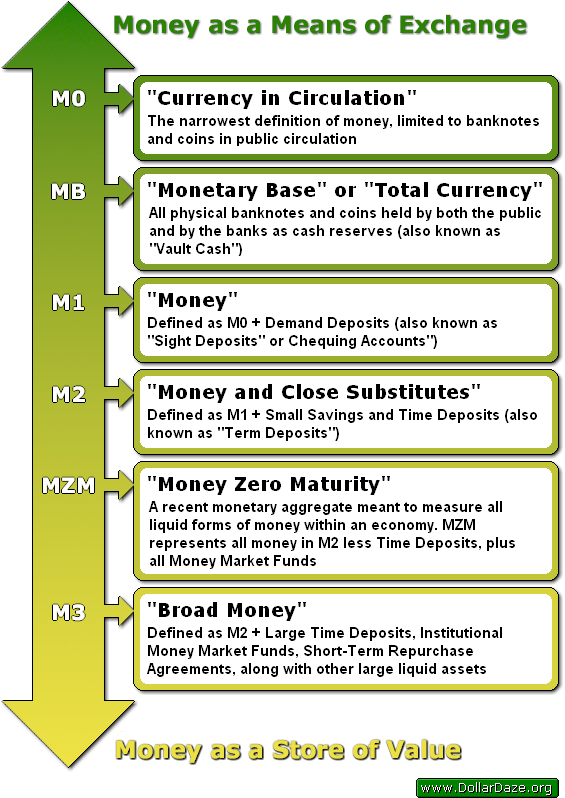
There are two other monetary measures worthy of mentioning:
M4: A less commonly used monetary aggregate, also known as "extended broad money". Depending on the country, it includes M3 + other types of deposits (such as those held by expatriate citizens or by various governmental agencies). This monetary measure is released by only a few countries.
TMS: ("True Money Supply") is a monetary measure developed by Murray Rothbard and Joseph T. Salerno of Austrian School of Economics fame which defines money as the final means of payment in all transactions . 5 The TMS consists of the following: Currency in Circulation, Total Demand Deposits, Savings Deposits, U.S. Government Demand Deposits and Note Balances, Demand Deposits Due to Foreign Commercial Banks, and Demand Deposits Due to Foreign Official Institutions. 6
The monetary aggregates compared in this analysis are the widely used M0, M1, M2 and M3. Global money supply data for this analysis was collected from official central bank websites , and the name of each country has been hyperlinked back to the source data for reference purposes.
Monetary Aggregates for Selected Countries
Not every country publishes all four of the common monetary aggregates. The United States ceased publishing M3 on May 23, 2006 . However, various independent sources have continued to publish U.S. M3 figures. One such provider of U.S. M3 money supply data can be found here .
In situations where a reliable alternative source was not identified, the lower order monetary aggregate was used, such as for China which does not publish M3, so M2 was used as a substitute.
All money supply figures in this analysis are taken from October 2008 where possible because of the high availability of data for that date. At the time of this publication, many money supply figures for the month of November are not yet available and only a few countries have released those for December.
For each monetary aggregate, the two charts show:
- Annual growth in percentage
- Annual growth in US$ billions
For the first calculation, the volume of currency of each each country was determined over a twelve month period and divided by the country's total outstanding currency in 2007 to provide a percentage increase.
To determine the annual growth in US$ billions, this same volume was converted to USD as per the exchange rates for the last business day of Oct 2008.
The currencies for the European Union (EUR), United States (USD), China (CNY), Japan (JPY), United Kingdom (GBP), Russia (RUR), India (INR), Brazil (BRL), Canada (CDN) and Switzerland (CHF) were included in each percentage growth chart because of their global economic and financial significance.
M0 - Currency in Circulation
As of October 2008, the nations used in this study combined had the equivalent of US$ 3,934 billion in public circulating banknotes and coins. The average percentage growth for currency in circulation from the 73 currencies in this analysis was 9.3%, which amounts to an annual increase of US$ 335.9 billion on the US$ 3,598 billion from Oct 2008. 7
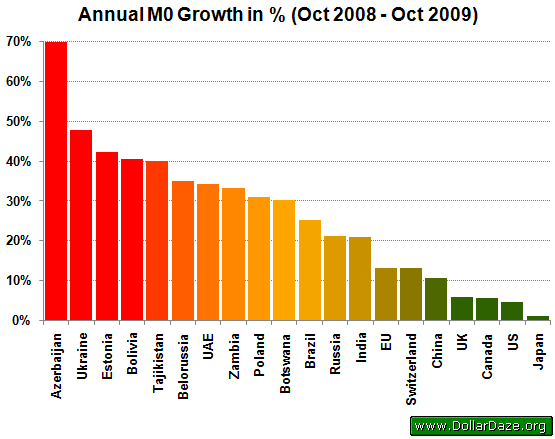
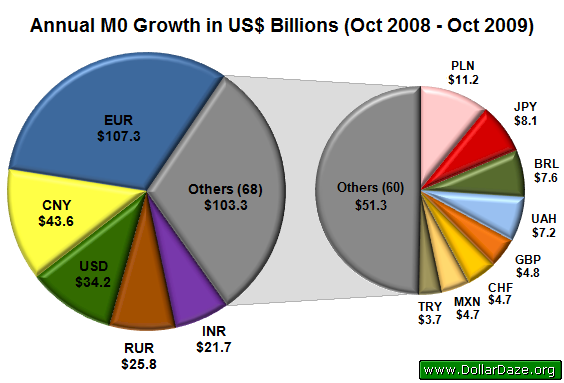
The Euro, Chinese Yuan and US Dollar were responsible for 55.1% of the increase in global M0. Together, these three currencies added the equivalent of US$ 185.1 billion to all banknotes and coins in public circulation.
M1 - Money
As of Oct 2008, there was the equivalent of US$ 19.2 trillion in demand deposits and public circulating banknotes and coins. The average percentage growth for money from the 73 currencies in this analysis was 5.0%, which amounts to an annual increase of US$ 908.7 billion on the US$ 18.2 trillion from Oct 2008.
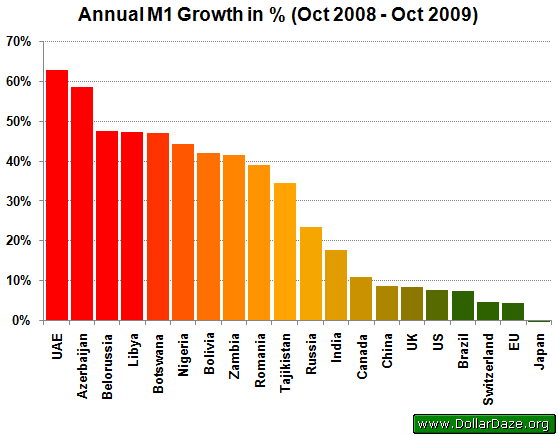
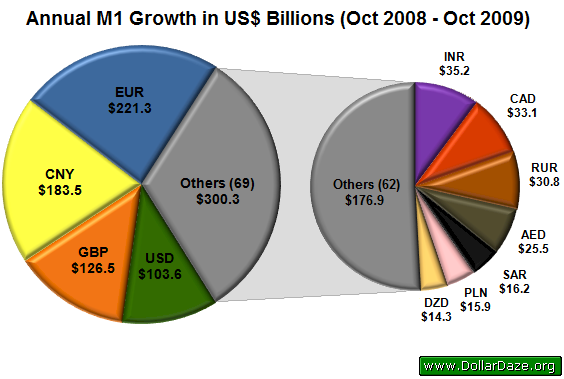
The Euro, Chinese Yuan and Pound Sterling were responsible for 58.5% of the increase in global M1. These three currencies together added the equivalent of US$ 531.3 billion to the global money supply.
M2 - Money and Close Substitutes
As of Oct 2008, there was the equivalent of US$ 45.2 trillion in money and quasi-money (savings and time deposits). The average percentage growth for money and close substitutes from the 73 currencies in this analysis was 10.0%, which amounts to an annual increase of US$ 4.1 trillion on the US$ 41.1 trillion from Oct 2008.
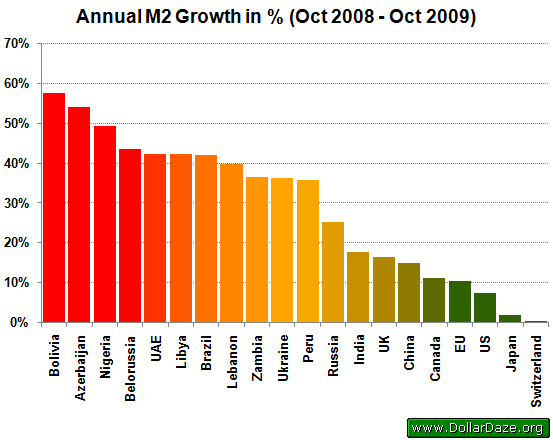
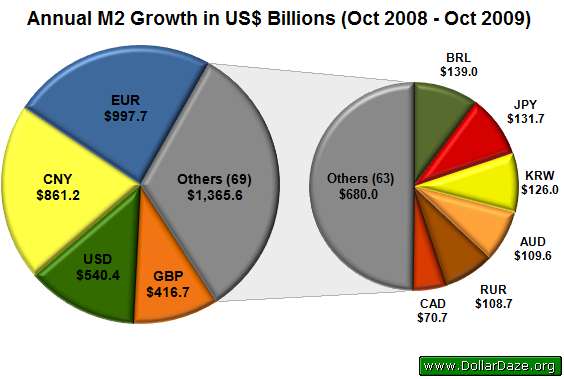
The Euro, Chinese Yuan and US Dollar were responsible for 58.4% of the increase in global M2. Together, these three currencies added the equivalent of US$ 2.4 trillion of money and money substitutes to the global M2.
M3 - Broad Money
As of Oct 2008, there was the equivalent of US$ 58.9 trillion in broad monetary aggregates. 8 The average percentage growth for broad money from the 73 currencies in this analysis was 9.6%, which amounts to an annual increase of US$ 5.2 trillion on the US$ 53.7 trillion from Oct 2008.
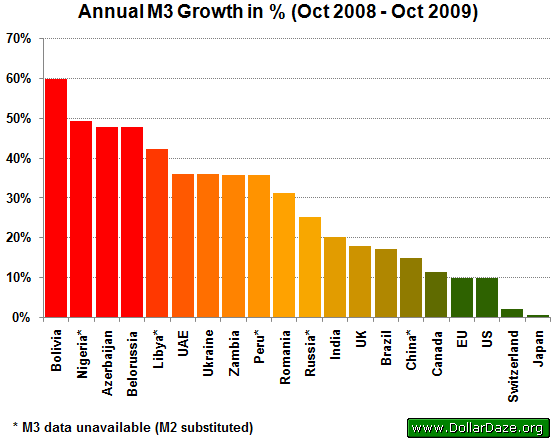
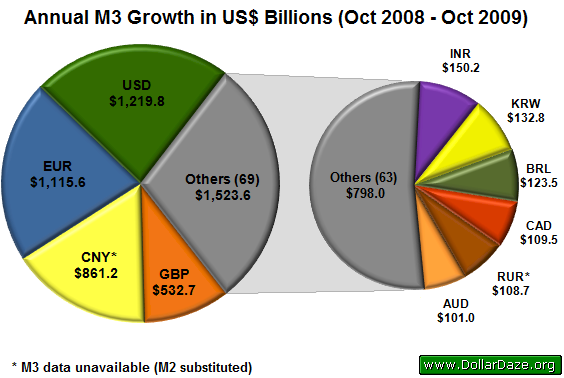
The Euro, Chinese Yuan and US Dollar were responsible for 61.7% of the increase in global M3. These three currencies together added the equivalent of US$ 3.2 trillion to the global broad money supply.
Historical Growth of the Global Money Supply
Compiled official global money supply data was used to create the following chart, which clearly shows an inflationary trend in the world's money supply from Jan 1970 to Oct 2008. 9
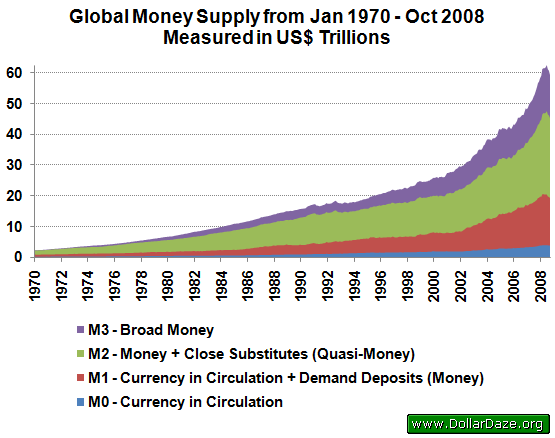
It is important to keep in mind that the traditional definitions for inflation and deflation refer to changes in the money supply and not to changes in prices, which are affected by other factors including supply and demand. Thus, while an increase in money supply may likely lead to an increase in the price of a good, it may not necessarily do so.
Due to the rapid appreciation of the US dollar near the end of 2008, there has been a recent decline in the value of the global money supply, as seen on the extreme right-hand side of the chart. It should be noted that while the value of the money in the latter half of 2008 may have declined, the volume of virtually every currency increased.
This recent strengthening of the US dollar and subsequent decline in the value of the global money supply is the result of a sharp demand for the currency caused by large portfolio-holders selling assets en mass in response to a global financial collapse. The author speculates that this 'flight to the dollar' will not last very long and that its value will fall as rapidly as it rose.
Notes
1 European Union includes Austria, Belgium, Finland, France, Germany, Greece, Ireland, Italy, Luxembourg, Netherlands, Portugal, Slovenia and Spain. The East Caribbean Union includes Anguilla, Antigua & Barbuda, Dominica, Grenada, Montserrat, Saint Kitts & Nevis, Saint Lucia, Saint Vincent & the Grenadines.
2 There are three agencies that tabulate Gross Domestic Products for countries - the International Monetary Fund (IMF), the World Bank, and the Central Intelligence Agency of the United States (CIA). Data for this calculation was taken from the IMF.
3 The "liquidity" of an asset is its readiness to be used as an accepted means of exchange to meet immediate and short-term obligations.
4 For instance, the Bank of England does not publish official numbers for M1, M2 or M3. For this article, estimates using European Economic and Monetary Union (EMU) aggregates for the U.K. are used. These standards are based on those employed by the European Union.
5 For instance, credit cards are not money, because use of a credit card in the purchase of a good does not finally discharge the debt created in the transaction. Instead, it gives rise to a second credit transaction which is concluded when you pay your monthly credit card bill. Mutual money market funds, while highly liquid and nominally fixed to a set value, are also not money because they first need to be sold in order to be reimbursed.
6 While the author is a proponent of this measure of money, for the purposes of this essay, comparisons were made using M0, M1, M2 and M3 because of their widespread availability from many countries.
7 Data for the month of Oct was not available for all currencies in the study (DZD, PKR, AED, SYP, IRR, BWP, HRK, ISK, JMD, LYD, PHP, RON, and ZAR). The dates are indicated on the table for reference. The aggregate value for growth from these thirteen countries was US$ 10.8 billion (or 3.2% of the total).
8 Previous analyses by the author have indicated similar sized monetary aggregates for a study of only 25 economic areas. It should be noted that currency conversion rates have a significant impact on cross-country comparisons. The USD underwent a large appreciation in the last half of 2008 which resulted in a lower value for other currency money supply figures.
9 Some amount of estimation was used to create the level of continuity necessary to draw a meaningful chart. In many cases, either a constant ratio to the US money supply or calculated monthly average was used.
By Mike Hewitt
http://www.dollardaze.org
Mike Hewitt is the editor of www.DollarDaze.org , a website pertaining to commentary on the instability of the global fiat monetary system and investment strategies on mining companies.
Disclaimer: The opinions expressed above are not intended to be taken as investment advice. It is to be taken as opinion only and I encourage you to complete your own due diligence when making an investment decision.
Mike Hewitt Archive |
© 2005-2022 http://www.MarketOracle.co.uk - The Market Oracle is a FREE Daily Financial Markets Analysis & Forecasting online publication.
Comments
|
Long John Silver
19 Jan 09, 11:32 |
Money Supply
Helpful collection of data, but not much good until updated for November and December. I think the next version of this will be an eye-popper... |