


Gold Fails to Get Stimulated
Commodities / Gold & Silver 2009 Jan 18, 2009 - 01:30 PM GMTBy: Merv_Burak

 $30 up, $30 down but in the end nothing seems to be happening. Do those “professionals” who are capable of moving prices REALLY know what's going on? Sometimes I wonder.
STIMULUS, STIMULUS EVERYWHERE
And it's all pure politics.
As Peter Foster, writing in the January 17, 2009 Financial Post, quoted that world famous political economist Groucho Marx's: “Politics is the art of looking for trouble, finding it everywhere, diagnosing it incorrectly, and applying the wrong remedies.”
So it goes around the world.
But let's just concentrate on our own little world, that of the precious metals and more particularly, gold.
GOLD
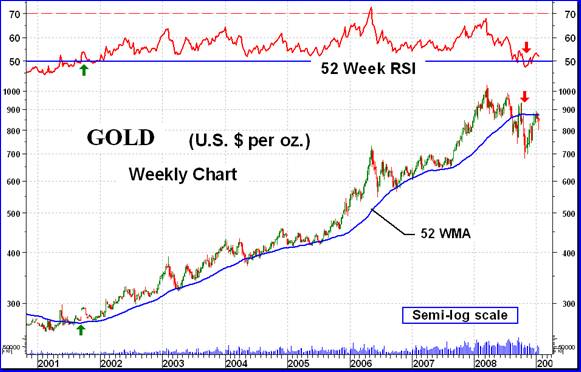
The chart today is one I show every so often. It is what I refer to as a very long term chart and includes a 52 week simple moving average line along with a 52 week Relative Strength Index (RSI). This gives us a broad picture of where we were and the prospects of where we might be going. To be in a bull market the RSI must be in its positive zone and the gold price must be above its positive sloping moving average line. The opposite is true for a bear market. The very long term bull market started, according to this weekly chart, on 21 Sept 2001 when gold closed at $291.90 and ended on 24 Oct 2008 when gold closed at $736.40. Now, when using a very long term chart and indicators one should not expect to get his signals at the very bottom or at the very top.
It is instructive to note the negative divergence in the RSI versus the price of gold at the top in early 2008, warning us of a possible very long term trend change ahead. Although I did not show it we had a similar positive divergence prior to the bull market in 2000 with the RSI continuing to strengthen while the price went nowhere, until the turn around. I last showed this chart in my commentary of 05 Dec 2008 . At that time I also presented my very long term Bearish Accelerating Fan trend lines which showed a blow-off stage and a reversal of trend very near the top on 04 Apr 2008 at a gold price of $917.30. So, there were a few warnings of a reversal for gold before the final very long term bear signal was given.
At the present time we are still within that bear market signal. Although the RSI is toying with its positive zone the price of gold continues to move below its negative moving average line. It would take a move by gold into the $900 range before we have the moving average line slope changing. So, for the next few months as long as gold stays below about $925 we can assume there is no change in the existing very long term bear market signal.
This very long term prognosis does not seem to correlate with the views of many other gold analysts. What would cause gold to go into a major price drop? Well, one thing I can think of, although I'm not convinced of the scenario, is the U.S, stimulus. If people perceive that the stimulus is (or may be) working then gold could take a huge tumble. Otherwise, I cannot think of any real reason for gold to drop precipitously, but I have to go with the charts. If they should change the my analysis will change.
As for our normal long term prognosis, first the P&F view. We are still within the P&F bull market with a projection to $930. However, with the up and down action we have been having lately a move now by gold to $795 or lower would reverse the bull back into a bear with the possibility of new lows ahead. For now we are still in a long term P&F bull market.
As for the normal chart and indicators, the price of gold closed above its long term moving average line on Friday, however, the line itself is still slightly pointing lower. The long term momentum indicator is just barely above its neutral line in the positive zone but is still below its negative sloping trigger line. Putting those together I get a long term rating of + NEUTRAL , one level below a full bullish rating.
INTERMEDIATE TERM
Looking at the intermediate term chart and indicators one notes that we were in a very precarious position a day or two back but the sharp upside move on Friday saved us for a later day. The gpld price is trading above its intermediate term moving average line and the line is gently sloping upwards. The momentum indicator was in its negative zone but perked up and is back in the positive. It closed on Friday just above its trigger line but the trigger is still pointing downward. As with the momentum, the volume indicator was below its trigger line but has now moved back above it. The trigger is still in a positive slope. All in all, the intermediate term is rated as BULLISH .
SHORT TERM
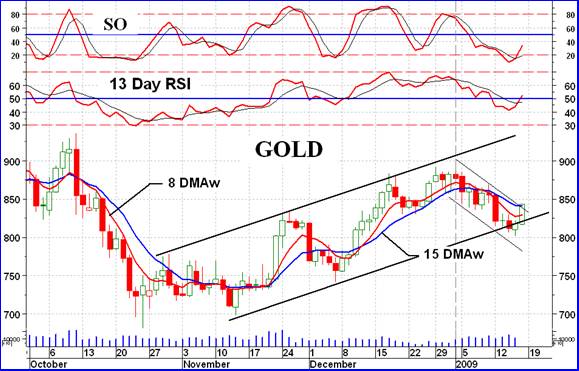
The short term just overshot a support but bounced up fast. It seems now to be back on its way to the upper channel trend line. The price closed just above its short term moving average line but the line is still slightly negative. The momentum indicator has also just crossed into its positive zone and the trigger line has turned upward. The daily volume still needs to perk up some more. Despite the slight lag in the moving average turning upwards the summation of indicators still gives me a short term rating of BULLISH>
As for the immediate direction of least resistance, that has now turned to the up side
SILVER
After breaking above its P&F consolidation area and above the down trend line silver seems to have stopped on a dime and has gone into a lateral phase. Although the momentum and price has gone lateral the volume indicator continues on its very positive move into higher ground. This gives one the confidence that the next real move will be back to the up side. A close at or above $12.00 will do it. The present close is above the intermediate term moving average line and the momentum indicator is just a hair from going into its positive zone. One more up day and it will be there. The silver intermediate term rating is therefore considered BULLISH.
PRECIOUS METAL STOCKS
As the Table shows, most of the stock Indices had a negative week. The S&P/TSX Global Gold Index seems to be the odd Index out. With a gain of 5.5% on the week this seems to reflect more the weakening in the Canadian Dollar versus the U.S. Dollar rather than any real difference in the stock activity. The other features of note are the gambling variety of stocks. The Gamb-Gold and Spec-Silver both had bad weeks. However, I guess this is small compensation for the previous good weeks that they had.
Looking over my list of top 25 performers for the three time periods (available to subscribers) it's interesting to note that the range of performance from number One to number 25 is almost the same for the short term and intermediate term, ranging from 269% down to 57% for the short term and from 215% down to 55% for the intermediate term. However, the long term still has a long way to go. More than half of the top 25 performing stocks on the long term were still in the negative performance range. The performance range for the long term was from 42% down to a negative 18% with the change from the positive to the negative occurring at stock number 12. Only 11 stocks are showing a positive long term performance, at this time. Not yet the kind of statistic to give one a good feeling on the long term.
Merv's Precious Metals Indices Table
Let's call it another week
By Merv Burak, CMT
Hudson Aero/Systems Inc.
Technical Information Group
for Merv's Precious Metals Central
For DAILY Uranium stock commentary and WEEKLY Uranium market update check out my new Technically Uranium with Merv blog at http://techuranium.blogspot.com .
During the day Merv practices his engineering profession as a Consulting Aerospace Engineer. Once the sun goes down and night descends upon the earth Merv dons his other hat as a Chartered Market Technician ( CMT ) and tries to decipher what's going on in the securities markets. As an underground surveyor in the gold mines of Canada 's Northwest Territories in his youth, Merv has a soft spot for the gold industry and has developed several Gold Indices reflecting different aspects of the industry. As a basically lazy individual Merv's driving focus is to KEEP IT SIMPLE .
To find out more about Merv's various Gold Indices and component stocks, please visit http://preciousmetalscentral.com . There you will find samples of the Indices and their component stocks plus other publications of interest to gold investors.
Before you invest, Always check your market timing with a Qualified Professional Market Technician
Merv Burak Archive |
© 2005-2022 http://www.MarketOracle.co.uk - The Market Oracle is a FREE Daily Financial Markets Analysis & Forecasting online publication.