


Waiting for the Obama Gold Rally
Commodities / Gold & Silver 2009 Mar 08, 2009 - 09:52 AM GMTBy: Merv_Burak

 After eight straight days of decline we finally had a couple of up days in the price of gold. Still, the upside was not all that convincing. I'm still waiting for that Obama rally (in gold, that is). It shouldn't be much longer now.
GOLD : LONG TERM
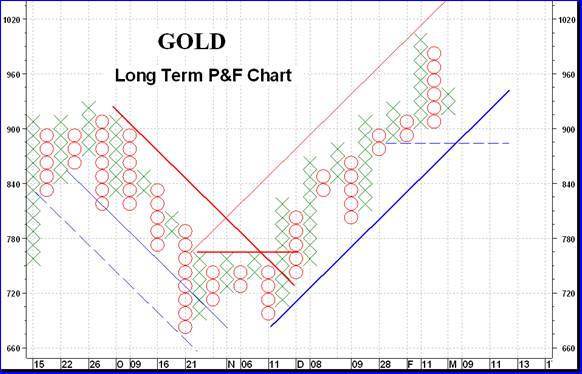
The slide that we have seen over the past couple of weeks has really not changed the long term outlook any. The long term P&F chart continues to be bullish and despite some ups and down continues to move ever higher. From past commentaries I still have a few projections for gold that remain valid. The intermediate term one is to the $1030 level (the previous high from over a year ago) then on to the next long term projection at $1125 and then on to $1600 with a final very long term projection to $2600. That's where we stand at the present time. These projections (the long term ones) could be nullified or at the least restrained if the price of gold should drop to $870 at which point the long term P&F chart would go bearish, but that's a long way off for now.
As for the normal indicators, the gold price remains above its positive sloping moving average line and the momentum indicator remains in its positive zone. The indicator is, however, below its negative sloping trigger line suggesting the momentum has been getting weaker but not yet weak enough to go negative itself. Another still positive momentum sign is the fact that the long term momentum indicator is bouncing off an up trend line from the November lows suggesting the up trend in momentum continues, at least for now. The volume indicator took a steep dive as could be expected from the 8 days of price decline. The indicator is below its long term trigger line and the trigger has just turned downward. Putting everything together I must still rate the long term price of gold as BULLISH at this time.
INTERMEDIATE TERM
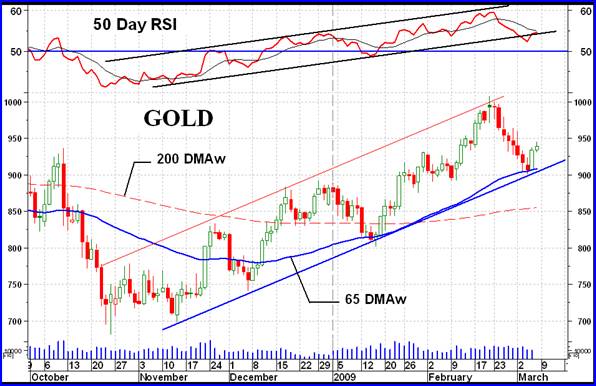
I continue to get questions as to my use of time periods for my Relative Strength Index (RSI) that are not often used by the masses. The normal time periods are 9 and 14 (or 13) days regardless of what time horizon information one is interested in. I like to use a time period compatible with the time period being investigated. That way the indicator is easier to read and interpret for that period. I use a 50 day RSI for intermediate term analysis and a 150 day RSI (or 30 week) for long term analysis. These have done very good service as far as providing momentum (or price move strength) information for the relevant time period.
As with the long term, the 8 days of down time has not changed the intermediate term trend, although it came pretty close. We have the action inside an up trending channel with the price bouncing off the lower support trend line. That is also the location of the intermediate term moving average line so one might have expected a good support where the price turned around. The momentum indicator had shown slightly weaker action and had broken below its lower support trend line but is just slightly back inside its channel again. The indicator is still in its positive zone but below its negative trigger line. The direction of the indicator is towards the down side but not yet weak enough to go negative. Putting these all together I still get a BULLISH rating for the intermediate term.
SHORT TERM
The short tern can fluctuate a lot. As you can imagine that 8 day down period had the short term as a bearish rating but with the Friday's action things have improved somewhat. The price is still below its negative sloping short term moving average line but above its positive very short term (8 DMAw) line. The short term momentum (here I do use the popular 13 Day RSI) had been in its negative zone but moved into the positive zone with the Thursday's action. It is still positive and above its positive trigger line. Because the price is below a negative moving average line I cannot give the short term a bullish rating. The best I can give it at this time would be a – NEUTRAL rating. It would not take much to further improve this rating.
As for the immediate direction of least resistance, that would be to the up side. The 8 days of negative action had given us a downward sloping very tight little channel pattern, in this case it might be referred to as a flag pattern. These are bullish patterns and we have the up side break on Thursday. I expect the up side to continue from here. The unknown is for how long?
SILVER
On the short and intermediate term silver continues to out perform gold. This past week the Qual-Silver Index was a real loser due to three of the 10 component stocks showing double digit losses. This is one reason I'm not enamored with Indices that have a limited number of stocks but in the case of silver there were so few stocks one could put into the “quality” category that that's what we got. On the other hand the Spec-Silver Index was the only Merv's Index that had a gain on the week.
PRECIOUS METAL STOCKS
The gold and silver stocks have had their run and now it's time for a rest. These past couple of weeks has seen the stocks come down and even change their ratings downward a notch. I would expect that the down motion will not last much longer although the trend may go into a lateral trend while the stocks catch their breath and prepare for the next move. We'll have a more detailed look at the stocks next week.
Merv's Precious Metals Indices Table
Well, that's it another week.
By Merv Burak, CMT
Hudson Aero/Systems Inc.
Technical Information Group
for Merv's Precious Metals Central
For DAILY Uranium stock commentary and WEEKLY Uranium market update check out my new Technically Uranium with Merv blog at http://techuranium.blogspot.com .
During the day Merv practices his engineering profession as a Consulting Aerospace Engineer. Once the sun goes down and night descends upon the earth Merv dons his other hat as a Chartered Market Technician ( CMT ) and tries to decipher what's going on in the securities markets. As an underground surveyor in the gold mines of Canada 's Northwest Territories in his youth, Merv has a soft spot for the gold industry and has developed several Gold Indices reflecting different aspects of the industry. As a basically lazy individual Merv's driving focus is to KEEP IT SIMPLE .
To find out more about Merv's various Gold Indices and component stocks, please visit http://preciousmetalscentral.com . There you will find samples of the Indices and their component stocks plus other publications of interest to gold investors.
Before you invest, Always check your market timing with a Qualified Professional Market Technician
Merv Burak Archive |
© 2005-2022 http://www.MarketOracle.co.uk - The Market Oracle is a FREE Daily Financial Markets Analysis & Forecasting online publication.