|
The Market Oracle Newsletter
13th July, 2016 Issue # 19 Vol. 10
|
|
|
Stocks Bull Market Crash Apocalypse Resolves to New All Time Highs - Again!
Dear Reader,
The stock market commentariat that had convinced themselves all year that a stocks bear market or worse a crash was always imminent, tending to reach their most vocal fever pitched cry's of doom each time stocks bottomed and where BrExit is concerned, well that was expected to be the icing on the bear cake, that if it happened would surely have herald an stock market apocalypse. Though of course most never saw it coming because the pollsters, markets and bookies ALL got the EU Referendum outcome WRONG which meant that WHEN it happened the expectations of doom reached a new level of intensity as their worst expectations appeared to finally becoming manifest. Worse still because FEAR SELLS the usually clueless mainstream press liberally regurgitated and magnified the utterance of financial sales industry so as to ensure few would ever be in a position to capitalise on the stock rally.
Well all they got was a couple days down draft of 5%, just allowing enough time to once more hook the bears on noose that was soon being tightened all the way to new stock market all time highs! All as most stared on open mouthed, as the stock market soared to new all time highs instead of collapsing into a Brexit black hole. Which once more highlights the fact that at least 90% of that which is out there as market analysis is GARBAGE which reinforces that people are better off NOT Listening to ANY market commentary or advice because the chances are heavily skewed in favour of that which you are listening to being complete and utter garbage that will cost you money and lost opportunities! In fact a coin toss is more accurate then the financial press! Right from the FT down to the lowly blogger, seriously a coin is more accurate, that way 50% of you will have known BrExit is going to happen against about 1% of the financial press.
The VIX that many analysts obsess over for signs of End Times has sharply fallen back which implies to expect calmer waters going forward, a more subdued trend than the recent rip roaring gyrations, so a period of calm before the next bull market storm. Though having hit the bottom if its recent range suggests a bounce higher is likely, probably towards 16 which implies to expect some stock market weakness.
Whilst one of the primary drivers for stocks for 2016, the crude oil price has so far not followed stocks to new highs which also suggests that stocks are due a breather for a few weeks so as to digest the bull run until the crude oil price is ready to join the party by also trending towards a new high for 2016, north of $52 later this year.
The actual trend in the crude oil price has been remarkably inline with my forecast expectations as of January 2016, in fact as the following illustrates that in forecasting terms one can't expect any better than what has actually come to pass for the past 6 months! Especially when one considers where the oil price is concerned most of the so called experts have been like reeds blowing in the wind as they RE-ACT to price movements AFTER the fact, always finding themselves on the WRONG side of that which follows, which is what one can expect from sales people for that is what most the so called experts really are!
17 Jan 2016 - Crude Oil Price Crash Triggering Global Instability, Trend Forecast 2016
Crude Oil Price 2016 Forecast Conclusion
My forecast conclusion is for the crude oil price to trade within three distinct trading ranges for 2016 of $20 to $40, $35 to $50 and $62 to $40. Furthermore the trend pattern imposed onto the trading ranges implies that a bottom is likely by early February 2016 at around $25, followed by a trend higher into Mid year towards $50, a correction into September, followed by a trend towards $62 before succumbing to a correction during December to target an end year price of approx $48 as illustrated by the following forecast graph.
So, again crude oil suggests that stocks should take a breather from their post-brexit party before marching higher, with my quick take suggesting a correction towards Dow 18k that I will come back to in greater depth and detail over the coming weeks.
This will sow the seeds for another noose for the bears to hang around their necks likely resulting in a version of the Revenant -
My last in-depth analysis of Mid May forecast expectations for the Dow to trend lower into the end of June towards 17k before bottoming and heading higher as illustrated by the following video analysis -
However my consistent view all year right form the depths of the January, February, March and June correction lows when expectations for stock market doom were at their extremes, right through to the post brexit apocalypse, my view has been consistent that the stock market during the second half of 2016 would resolve in a trend to new all time highs, why ?
Well again the reason has remained consistent virtually since the stock market bottomed in March 2009 which is that manipulated asset markets such as stocks and housing are LEVERAGED to Central bank MONEY PRINTING INFLATION!
15 Mar 2009 - Stealth Bull Market Follows Stocks Bear Market Bottom at Dow 6,470
The markets ARE manipulated, once you as a small investor come to agree with this statement then you can take the necessary steps to prevent yourself from being wiped out by ALWAYS keeping this in mind that Manipulated markets WANT you to act in a certain manner at certain times, they want you to buy into the latter stages of a bubble as the manipulators distribute, and the market manipulators want you to SELL into Market Bottoms and early bull rallies when the manipulators are accumulating.
Who are the market manipulators ? Today it is the Investment banks, investment funds, CEO's (stock options) and last but not least HEDGE FUNDS that created the stocks bubble through leverage of X20 or more that subsequently bankrupted the banks that were driven insane by short-term greed with trillions of dollars of liabilities which have NOW been fraudulently dumped onto the tax payers. I have not heard a single story of a hedge fund manager losing money, not one! They have BANKED their profits ! The losers are their investors who held on and the banks who leveraged them up to the tune of tens of trillions, and in the final instance the Tax payers who are being FORCED to bail out the bankrupt banks to the tunes of tens of trillions!
The only thing that actually matters is the PRICE ! NOTHING ELSE! and I mean NOTHING ! Not earnings, Not fundamentals. Listen to the PRICE or you WILL miss the Stealth Bull Market!
So how much has been collectively printed by the worlds central banks since 2008? We'll its probably in excess of $100 trillion, (a good $30 trillion of which has been hidden away), to which asset prices are LEVERAGED! And that is why despite perpetual doom and gloom stocks and housing continue to resolve towards NEW ALL TIME HIGHS! In fact I wrote a ebook on it published near 6 years go in January 2010 called the "Inflation Mega-trend" (FREE DOWNLOAD) and then again ebook's followed on the stocks stealth bull market in Feb 2011 and Feb 2013, all of which have been available for download for free since publication.
Furthermore my message for the duration of the 7 year stocks stealth bull market has been very simple which is that the "greater the deviation from the bull market peak then the greater the buying opportunity presented".
So ahead of my next in-depth analysis that will follow a rap up of BrExit and its aftermath then here are the summaries of this years stocks articles that iterated the point that this stocks bull market is only just getting started and would run far beyond anything anyone was expecting it do, just as I concluded several years ago in my stocks stealth bull market ebook's.
So unlike the perma-clueless who clearly DON'T TRADE or INVEST for if they did they would have gone BROKE several times over by now, I am not writing this with the benefit of hindsight AFTER stocks have traded at a new all time high but rather has been my consistent conclusion of virtually every piece of stock analysis ALL YEAR!
My forthcoming newsletter will cover intermediate stock market tend analysis and concluding trend forecasts, in the mean time see my two stock market ebook's for long-term drivers and insights as excerpted below -
Implication for stocks - Just as QE1 and QE2 were BULLISH (inflating asset prices) so will QE3 and after it QE4 that reinforces the primary bull market trend, for the U.S. will not stop printing money whilst the budget deficit remains anywhere near 10% of GDP (current approx 9%) and each time the U.S. announces another print run (QEx...) so it will imply ever higher future Inflation AND Interest Rates and so will weaken the U.S. Dollar (in relative terms because all fiat currencies are in free fall against one another), but not to worry asset prices are leveraged to real inflation courtesy of the likes of QE which means stocks should out perform loss of purchasing power.
In terms of market timing, weakness ahead of the end of QE2 in June and into the no mans land before the announcement of QE3.
So pay no attention to analysts / mainstream financial press and the Fed noises indicating an end to QE, instead keep your eye on the U.S. budget deficit as the most reliable indicator for future QE, and so I don't see why I should change my view that QE will run for the whole decade as the U.S. follows Japan towards debt at 200% of GDP (monetized courtesy of the Fed), though probably QE9 will be the straw that breaks the camels back.
Formulating a Stock Market Conclusion for 2011
The overwhelming conclusion is that of stocks remaining in a MULTI-YEAR BULL MARKET that is being driven higher by a number of fundamental factors such as corporate earnings OR Fed MONEY PRINTING (POMO). It does not matter which is prevalent at a particular point in time as the market SPIRALS HIGHER in reaction to waves of INFLATIONARY buying pressure, something that the dark pools of capital recognised right at the birth of the Stocks Stealth Bull Market in March 2009 (15 Mar 2009 - Stealth Bull Market Follows Stocks Bear Market Bottom at Dow 6,470 ) and have since been eager to bid the stock market higher whilst MOST have FAILED to participate on the rally to date as they have been fooled into waiting for the bear market bottom to materialise (or even worse have been actively engaged in betting against the bull market) and will continue to do so all the way to new all time highs which is why this remains STOCKS STEALTH BULL MARKET.
The same INFLATIONARY forces are driving up ALL assets such as commodities, whilst at the same time holding up other weaker assets such as housing that should be in free fall as the bubble baton has been passed from one asset class to another.
In our fiat currency, big government deficit spending, debt accumulating world, governments CANNOT ALLOW FOR DEFLATION, not only that but inflation can literally always be created at the press of a button, therefore as asset prices are leveraged to consumer prices that is where wealth protection strategies should continue to be focused.
The reason why many analysts can miss whole bull and bear markets is because they get attached to one or two elements and then run a mile with it, such as the rise of China and India and demise of the U.S. along with much of the west, or the impact of demographics as ageing populations hit the west hard, though China will be hit even harder in the 2020's, or the fact that the US is on the path towards bankruptcy (by means of high inflation), well yes it is, but so what? Because that path will contain many bull and bear markets, the consequences of a bankruptcy event are probably many decades away. So one needs to be focused on the time horizons at hand not take a view of the world say 40 years down the road when there is so much that can happen between now and then (as the Japan environmental and nuclear disaster illustrates) that can completely flip the future world view on its head. So what is going to happen or not happen 40 years from now is pretty much irrelevant in determining the stock market trend for 2011.
Key points to consider are that the US economy is strengthening, the world economy is improving (despite the Japan black swan), that slowly the Eurozone is immunizing itself form the bankrupting PIIGS, and without repeating what's stated at length in the Interest Rate Mega-Trend Ebook (FREE DOWNLOAD) that despite the bankrupt banks still remaining bankrupt, but less so than where they were a year ago, and so long as they remain busted the worlds central banks fearing financial armageddon are continuing the flow of easy money so as to transfer tax payer / savers wealth onto the balance sheet of the bankrupt banks which looks set to continue for at least the remainder of 2011. Yes all this money printing primarily as an aid for the bankrupt banks to put even bigger bets on the derivatives markets that is INFLATING asset prices such as stocks and commodities. Yes all this also means ever higher real world inflation which stock prices are leveraged to, but again that was covered at length in the Inflation Mega-trend Ebook of January 2010. (FREE DOWNLOAD)
The technical picture remains bullish on near every level for 2011, as much of the consensus view on the impact of the likes of rising interest rates are just flat out wrong! Rising Interest rates are BULLISH for stocks! It's what happens AFTER interest rates have risen that hits the stock market and economy, and not during the actual trend. Even the highly contrary Hindenburg Crash Omen has been doing the rounds again in the mainstream press just as the market bottomed (why does the financial press never learn?).
Therefore there is nothing in this analysis to suggest that an end to the stocks stealth bull market is imminent, far from it, I see no reason why the stock market should not continue trending higher well into 2012 (yes there will be corrections for the highly vocal perma-bears to pounce upon once more to announce an end to the non existant bear market rally).
So the question left to answer is to what heights will the stock market reach by the end of 2011 / early 2012, which I next attempt to conclude towards.
Fundamental Inflationary Background
The fundamental background remains of ever expanding waves of highly inflationary central bank money printing liquidity that washes over all markets. Deflationists such as Krugman and his disciples bang on and on about deflation, about destruction of demand that will result in deflation, about debt deleveraging that will result in deflation. What the deflationists remain blind to is the fact that the central banks such as the Fed, and the Bank of England have been stuffing every orifice of the deleveraging banks with free money, the US alone has stuffed its banks with over $2 trillion of support which results in artificial profits as the banks risks / debts have been systematically transferred to the central banks balance sheets. Which is WHY FALLING DEMAND and FALLING WAGES are NOT resulting in Deflation! because in totality there HAS BEEN NO DEBT DELEVERAGING, TOTAL DEBT IN FACT CONTINUES TO EXPAND as central banks MONETIZE GOVERNMENT DEBT and in some cases EXPOENENTIALLY. And not only that but money printing AKA QE is far worse for an economy than Debt money (bank created credit) because it REALLY has just been conjured out of thin air with no economic activity to justify its creation.
This is why prices WILL rise, ALL prices including asset prices because of central bank QE which should not just be seen as free money for the banks but direct deliberate debasement of the currency. Unlike bank credit It WILL NEVER be destroyed instead feeds the Inflation Mega-trend which I termed in March 2009 as QE really being Quantitative Inflation. I know this may be getting rather complicated, so if you want to understand only one thing, know this that money printing by central banks is highly inflationary, highly corrosive to the purchasing power of a currency, which is why despite all of the academic reasons why we 'should' have deflation in reality we have INFLATION.
The Exponential Inflation Mega-trend
The US and every other nation is emerged in what is an exponential inflation mega-trend which the below graph clearly illustrates that even on the official CPI inflation measure (which tends to under report real inflation), that the US is no different to any other country which contrary to the delusional deflation propaganda is instead immersed in what has always been an exponential inflation mega-trend where vested interests have instead been blindly regurgitating the threats of deflation ever since the Great Recession of the 2008-2009, which the graph clearly illustrates amounted to nothing more than a mere blip or as I warned of at the time as being a mere deflationary ripple on the surface of an ocean of Inflation.
On the basis of the probable simple pattern being for a 5th of a 5th, then this analysis further concludes that the termination point for the 5th of a 5th is a Larger Wave 1 and therefore implies a further 2 Larger Impulse waves 3 and 5 as the following graph illustrates -
Peering into the Mists of Time
If you have actually read the whole of this analysis (rather than just skipping to the conclusion) then the message you will get is one of an ongoing stocks bull market that like a coiled spring is prepping itself to propel the stock market to levels that cannot be imagined today I.e. my Elliott Wave and broadening top analysis gives strong indications for longer-term expectations. For instance, I can easily see the Dow trade at 20,000 during 2017, so expect plenty more Stocks Stealth Bull Market ebook's to follow.
The 2013 ebook also contained the :
The Real Secrets of Successful Trading
For at least the past 5 years I have wanted to write a book on the real secrets of successful trading but have never found the time to get around to doing so. However I have alluded to where the secret lies many times, in articles and more specifically in comments. The most notable of which is suggesting those wanting to learn the real secret of successful trading should watch the early 1980's film Excalibur, for the seed for their own light bulb moment.
The Excalibur movie is the 1980's replay of the King Arthur myth focused on the hunt for the holy grail, (I think I first watched this movie in 1983). That should perk your interest because most traders very early on in their trading careers are convinced and easily seduced by the search for the holy grail of trading, even more so today where the internet is full of a multitude of competing holy grails out to hook traders into handing over huge sums of money for the privileged for learning.
However, I have had several advantages over today's traders in my early years such as there was no internet, no smart phones, and the local library shelves bare of trading books so there was nothing to pollute my understanding of markets and trading unlike the case today where traders of all abilities can easily find themselves drowning in an ocean of various holy churches of Technical Analysis of tools, methodologies and theories. Neither was I immersed in a reinforcing trading culture as many today find themselves at the heart of the worlds major financial market trading cities such as London, New York and Chicago. Instead, I found myself trading in the back waters of far distant from the centres of the financial world, a blank canvas with no access to the consensus view of how one should trade or interpret markets.
The movie Excalibur planted the seed that germinated into an important element involved in the development of my trading methodology that ultimately was able to even beat the Great Crash of 1987 that claimed many traders in its midst's. Not because I was somehow special but because I literally traded in a bubble that was filled with the likes of Excalibur and Chaos Theory, and NOT TA, and as long as I remained in that isolated bubble I was immune to the effects of the holy Churches of TA whose missionaries are always eager to seek conversion of others for a fee on promises of untold riches, that in my opinion amounts to nothing more than a sales industry geared towards selling what does not actually work as I illustrated earlier.
Excalibur Light Bulb Moment - The Real Secret of Successful Trading
.....
Excerpts from 2016 Stock Market Analysis:
Trading Brexit Video:
23 Jun 2016 - Trading BrExit - Stocks, Bonds, Sterling, Opinion Polls, Bookmaker Odds and My Forecast
In terms of trading the markets, and despite the markets apparently no longer treating Brexit consequences seriously, a case of whatever happens it will be business as usual, nevertheless a BrExit outcome will result in sharp downwards swings for sterling and FTSE, even if the moves prove temporary as the politicians and central bank officials are likely to respond to both with market soothing words of nothing has really changed and of course the Bank of England releasing tens of billions of more market liquidity support.
So taking account of my forecast conclusion for a BrExit outcome then the current stock and forex markets are offering the potential for good risk vs reward short-term trades. However remember that volatility will be HIGH which means that even if one gets the direction right then if the stops are not set wide enough then traders can get stopped out of positions BEFORE the profit making moves take place. Or that of REMAIN does win then the market may gap well beyond ones stops resulting in larger losses than the potential that had been allowed for.
And so also are the bookmakers giving what appear to be good risk vs rewards odds of 4.3 to 1.
Friday definitely looks set to be a very interesting trading day, your analyst hoping he does not get stopped out of short side profit making moves!
23 May 2016 - Stock Market Crash Death Cross Doom Prevails
Where are we in terms of the consensus parameters of 50 day vs 200 day?
Firstly, currently there IS NO DEATH CROSS, instead the last signal was a BUY SIGNAL
Secondly the last death cross of January 2016 was a FAIL, i.e. by the time of the cross the Dow had already fallen and bottomed literally within days, so ALL those who acted on the January death cross signal would have been wiped out by the subsequent rally.
Thirdly, the August 2015 death cross could have proved profitable IF those who acted on it exited within a couple of weeks or so. But the problem is that the highly vocal advocates of the death cross tend to see it in terms of the start of NEW BEAR MARKETs or worse rather than a short-term technical trading tool.
The bottom line is that a coin flip is a MORE reliable than the death cross. Which highlights the point I often make that each technical tool such as death cross's and elliot wave theory on their own are little more than 50/50 propositions which therefore means one should be skeptical of ones own analysis else one falls into the same trap that the death cross merchants have today, who believe they have found the holy grail but in reality are just fooling themselves, to suffer from cognitive dissonance when the stock market actually does the opposite of what they expected it to do, whilst at the same time they cling on their death crosses in perpetuity.
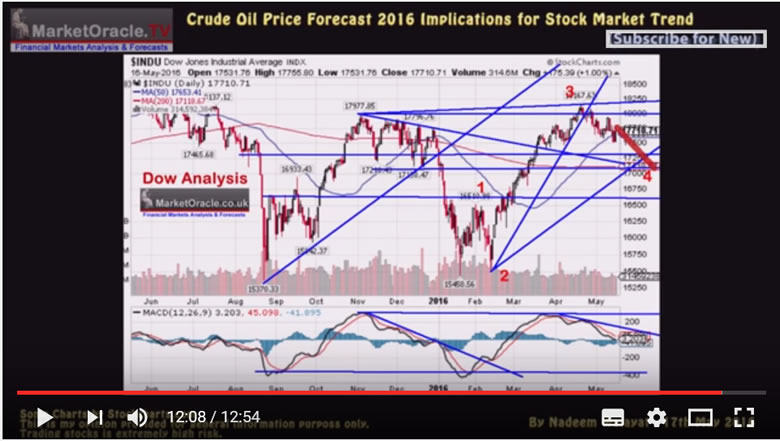
17 May 2016 - Crude Oil Price Trend Forecast 2016 Implications for Stock Market
My latest video analysis seeks to update what has transpired since, and whether the crude oil price remains on track to to continue trending towards $60 before the end of this year, and what this means for the stock market that I have consistently stated should track the crude oil price rally higher, whilst many if not most have long since convinced themselves that stocks were not only in a bear market but that a crash was always liniment! So found out the prospects for oil and the stock market in my latest video analysis -
21 Apr 2016 - Stocks Bear Market 2016 Illusion Persists Despite Dow Targeting New All Time High
The so called great stocks bear market of 2016 that apparently began following the Dow's May 2015 all time high of Dow 18,351, has seen bear market rhetoric reaching its most fever pitch as the Dow bottomed out in late August 2015 at Dow 15,370, and then again more recently in January of this year. So how has this so called bear market been progressing? A bear market heralded by even those who may have been bullish from time to time.
For instance a quick google search resolves in the following headlines from one prominent analyst. “The Dow is set to embark on a catastrophic plunge…all the way down to 6,000.” - Harry Dent - 29th Feb 2016
And a selection from moneymorning.com - 28th August, - Is This a Bear Market?
It actually indicates there's a 99.7% chance we're already in a bear market.
And money morning continuing into early November This One Number Makes Me Think the Market Rally Is Over
I believe the S&P 500 is entering a bear market and we are now experiencing a classic bear market rally.
And more recently Here's Why the Bear Market Rally Could End Soon - 10th April 2016 (Dow 17,577)
Last week the stock market experienced a pop in volatility. Often, higher volatility signals a shift from one type of market to another.
In this case, it may indicate that the market rally is coming to an end and the bear market will resume.
Well the Dow's last close of 18,096 says it all! The Dow now stands a little over 1% away from setting a NEW ALL TIME HIGH! Yes, as the Dow chart illustrates the ride has been bumpy to say the least, where in dozens of stock market articles during the past 9 months, (http://www.marketoracle.co.uk/UserInfo-Nadeem_Walayat.html) I illustrated that it is what an ageing bull market actually wants to see happen so that it can keep giving the bears a noose to put around their necks every few months or so, along with shaking out weak longs, it's when virtually everyone's bullish and certain of rising stock prices when bull markets tend to END!
And Money Morning more recently on BrExit day - 23rd June 2016 - Is a Stock Market Crash Coming After Brexit Vote Results?
These Four Factors Could Cause a Stock Market Crash in 2016
Stock Market Crash Factor No. 1, Negative Rates: .....
If these warning signs do indeed lead to a stock market crash in 2016, you need to be prepared to protect your portfolio. Here are three ways to plan for and protect against an upcoming stock market crash…
And a reminder that my consistent view for the duration of this year, even in the depths of Januarys severe correction was that the stock market would resolve with a trend towards NEW ALL TIME HIGHS THIS YEAR based on my in-depth crude oil price analysis of Mid January:
02 Mar 2016 - Stock Markets Dow, FTSE Tracking Crude Oil Rally Towards New All Time Highs 2016!
What jumps out form the chart is that the Dow has bounced thrice off of the August low, recently putting in a double bottom that has propelled stocks higher to the last close, a measuring move that's appears just about done and therefore targets a correction to probably between Dow 16,250 and Dow 16,000 as being the immediate term prospects for the Dow over the next week or so.
Nevertheless my series of interim stock market posts and videos have been unequivocally consistent in the following two points :
1. That the stock market was under going a severe correction that would resolve in a resumption of the stocks bull market.
2. That the stock market was expected to track the crude oil price trend forecast which called for an early Feb low at approx $25.
25 Jan 2016 - Stock Market Bottoming Out or the Last Bull Standing?
Stock Market Quick Technical Take
What jumps out form the stock chart is that the recent bounce was off the August low, can it hold ? We'll the decline into the low was pretty severe which technically means it's unlikely to hold which means that the stock market is in a larger corrective pattern that began of the May 2015 high, which is a pretty lengthy corrective pattern in terms of time i.e. from May to probably February, which has acted to unwind much bullish sentiment to the point where even many of the former bulls are now fully fledged bears, probably reaching their most vocal just as the stock market puts in its bottom.
MACD - Additionally the MACD is in the process of bottoming out from an extreme low which also confirms that further downside is very limited.
The bottom line is that the oil price trend and the stock markets oversold state are converging towards a stock market bottom that should carve out a final bottom for 2016 in a time window that probably runs for another 2-3 weeks. So whilst it is probably not going look pretty i.e. the last low of 15,500 looks likely to break, however given the oil price trend forecast then it should form the end of this stock market correction and herald the resumption of the stocks bull market.
However, there are times when even a bull can be surprised by bull market strength as illustrated by most recent interim analysis of 30th March 2016 that concluded in expectations for an imminent correction of about 5% starting early April so as to hand the bears another noose to hang themselves with, as I expected the correction to eventually resolve in a trend towards new all time highs -
30 Mar 2016 - Stocks Bull Market About to Hand Bears Another Noose? Forecast 2016
Stock Market Forecast
Whilst the Dow has yet to give a technical SELL signal, i.e. is still in rally mode. Nevertheless component analysis is clearly converging towards imminent bearish expectations for the stock market. However, we would still be in a BULL market, which implies that stocks are likely to undergo a correction to a range of between Dow 16,800 to as low as Dow 16,500 against the last close of 17,633 over the coming weeks ahead of the Fed or another major central bank announcing its going to print money for election year 2016.
Therefore, as the title of this article implies, the bears are about to be handed another noose to put around their necks, who I am sure will reach their most vocal just as the stock market correction bottoms and snaps higher by probably late April.
Alternative
If the conclusion for a correction proves wrong then the next most probable alternative would be for the Dow to blast off towards new all time highs, which will likely also be accompanied by stronger oil prices.
Crude Oil Price Forecast Implications for stock prices:
25 Jan 2016 - Stock Market Bottoming Out or the Last Bull Standing?

My forecast conclusions were for the oil price bear market to have made it's final bottom BY early February 2016 and embark on a bull market that would target a a trend towards a late year high of $60 as excerpted below :
17 Jan 2016 - Crude Oil Price Crash Triggering Global Instability, Trend Forecast 2016
Crude Oil Price 2016 Forecast Conclusion
My forecast conclusion is for the crude oil price to trade within three distinct trading ranges for 2016 of $20 to $40, $35 to $50 and $62 to $40. Furthermore the trend pattern imposed onto the trading ranges implies that a bottom is likely by early February 2016 at around $25, followed by a trend higher into Mid year towards $50, a correction into September, followed by a trend towards $62 before succumbing to a correction during December to target an end year price of approx $48 as illustrated by the following forecast graph.
The bottom line is that the current the oil price collapse is a wake up call to all major oil producers that crude oil as an energy source is running out of time. So whilst there may be future oil price spikes, however the long-term trend, given the likes of climate change is for the oil age to go the way of previous ages such as the Stone Age and Bronze age and so it will be for the oil age. Which means nations such as Saudi Arabia, regardless of price understand they need to get as much of their oil out of the ground as possible and sold off before they run out of customers!
Crude Oil Implications for the Stock Market
Having a forecast conclusion for the oil price for 2016 allows me to quickly gauge what this means in terms of any correlation between oil and stock price trends, i.e. when the oil price rises do stocks tend to rise or not, or is the relationship more inverse, i.e. a falling oil price is definitely a net economic boom for most major western economies given the fact that their level of oil consumption tends to be is far greater than production and thus a falling oil price acts to cut import bills and boost consumer spending as the cost of travel falls resulting in more cash in the pocket for ordinary consumers. Against this we have the negative impact of oil sector companies in distress that ripples out to other sectors that acts to destabilise the financial markets i.e. precisely which we have been witnessing so far this year.
Firstly, what stands out is that there is a strong correlation in swing between the oil price and the stock market but not in trend i.e. if the oil price is swinging lower then the stock market usually also soon starts to swing lower, as the oil price tends to lead the stock market swings. Also it's not a case of if the oil price falls today then the stock market will also fall as same day direction only tends to occur about 50% of the time. Conversely when the oil price is swinging higher then the stock market will tend to swing higher. Of course this is not a iron caste 100% rule for at the end of the day it is just one supplementary inter-market indicator.
The goldilocks oil price range for stocks appears to be between about $112 and $75, a range that we are unlikely to see a return to any time soon, i.e. for the whole of 2016, so implies relative weakness for stocks.
Secondly, a falling oil price is a net positive for the general stock market upto a point and that point appears to be around $40, below which stock market investors appear to lose some touch with reality and perceive the drop below $40 as the harbinger of economic and thus stock market catastrophe, which actually does have some fundamental basis i.e. loss of demand due to loss of economic activity and implications for the heavily in-debted energy sector pulling the general stock market indices lower.
So where the stock market is concerned $40 appears to be the KEY level, below which we see what we have been witnessing in terms of trend weakness, whereas the closer the oil price gets to attaining $40 the more calm we are likely to witness and strengthening trend. Which given my forecast for an oil price low by early Feb 2016, implies that we are now within a 2-3 week window for the stock market to bottom out. So whilst we are probably in for bumpy ride over the next few weeks, however, according to the oil price swing correlation it's not all doom and gloom once the oil price starts to gravitate towards $40, which given the last price of $32, may not be that far off.
Conversely, one needs to watch for deviation from the oil price trend forecast as a harbinger for stock market strength or weakness going forward i.e. $20, or even $10 is going to result in very bloody stock market chart. So do bear that in mind as some need to be reminded that the trend forecasts are the conclusions of what I deem to be the most probable following in-depth analysis and not some prophetic utterances from a man-god deity.
Stock Market Quick Technical Take
What jumps out form the stock chart is that the recent bounce was off the August low, can it hold ? We'll the decline into the low was pretty severe which technically means it's unlikely to hold which means that the stock market is in a larger corrective pattern that began of the May 2015 high, which is a pretty lengthy corrective pattern in terms of time i.e. from May to probably February, which has acted to unwind much bullish sentiment to the point where even many of the former bulls are now fully fledged bears, probably reaching their most vocal just as the stock market puts in its bottom.
MACD - Additionally the MACD is in the process of bottoming out from an extreme low which also confirms that further downside is very limited.
The bottom line is that the oil price trend and the stock markets oversold state are converging towards a stock market bottom that should carve out a final bottom for 2016 in a time window that probably runs for another 2-3 weeks. So whilst it is probably not going look pretty i.e. the last low of 15,500 looks likely to break, however given the oil price trend forecast then it should form the end of this stock market correction and herald the resumption of the stocks bull market.
With the Dow as I write trading at new all time highs then ensure you are subscribed to my always free newsletter for forthcoming in-depth analysis and detailed trend forecasts.
Source and Comments: http://www.marketoracle.co.uk/Article55874.html
By Nadeem Walayat
http://www.marketoracle.co.uk
Copyright © 2005-2016 Marketoracle.co.uk (Market Oracle Ltd). All rights reserved.
Nadeem Walayat has over 25 years experience of trading derivatives, portfolio management and analysing the financial markets, including one of few who both anticipated and Beat the 1987 Crash. Nadeem's forward looking analysis focuses on UK inflation, economy, interest rates and housing market. He is the author of five ebook's in the The Inflation Mega-Trend and Stocks Stealth Bull Market series that can be downloaded for Free.
    
 Nadeem is the Editor of The Market Oracle, a FREE Daily Financial Markets Analysis & Forecasting online publication that presents in-depth analysis from over 1000 experienced analysts on a range of views of the probable direction of the financial markets, thus enabling our readers to arrive at an informed opinion on future market direction. http://www.marketoracle.co.uk Nadeem is the Editor of The Market Oracle, a FREE Daily Financial Markets Analysis & Forecasting online publication that presents in-depth analysis from over 1000 experienced analysts on a range of views of the probable direction of the financial markets, thus enabling our readers to arrive at an informed opinion on future market direction. http://www.marketoracle.co.uk
Disclaimer: The above is a matter of opinion provided for general information purposes only and is not intended as investment advice. Information and analysis above are derived from sources and utilising methods believed to be reliable, but we cannot accept responsibility for any trading losses you may incur as a result of this analysis. Individuals should consult with their personal financial advisors before engaging in any trading activities.
You're receiving this Email because you've registered with our website.
How to Subscribe
Click here to register and get our FREE Newsletter
To access the Newsletter archive this link
Forward a Message to Someone [FORWARD]
To update your preferences [PREFERENCES]
How to Unsubscribe - [UNSUBSCRIBE]
| About: The Market Oracle Newsletter |
The Market Oracle is a FREE Financial Markets Forecasting & Analysis Newsletter and online publication.
(c) 2005-2016 MarketOracle.co.uk (Market Oracle Ltd) - The Market Oracle asserts copyright on all articles authored by our editorial team. Any and all information provided within this newsletter is for general information purposes only and Market Oracle do not warrant the accuracy, timeliness or suitability of any information provided in this newsletter. nor is or shall be deemed to constitute, financial or any other advice or recommendation by us. and are also not meant to be investment advice or solicitation or recommendation to establish market positions. We recommend that independent professional advice is obtained before you make any investment or trading decisions. ( Market Oracle Ltd , Registered in England and Wales, Company no 6387055. Registered office: International House, 124 Cromwell Road, Kensington, London, SW7 4ET, UK )
Terms of Use | Privacy Policy
|


 The Market Oracle Newsletter