


Stock Market Rally Red Flags
Stock-Markets / Stock Index Trading May 25, 2009 - 05:58 AM GMTBy: Jack_Steiman

 I have spoken about the red flags that are out there but we all know you don't turn bearish just because you are starting to see some red flags. It puts us on heightened awareness no doubt but you don't just flip sides until you see the proper sell signal get put in to place. That would a break and close convincingly below 862 S&P 500 or its 50 day exponential moving average.
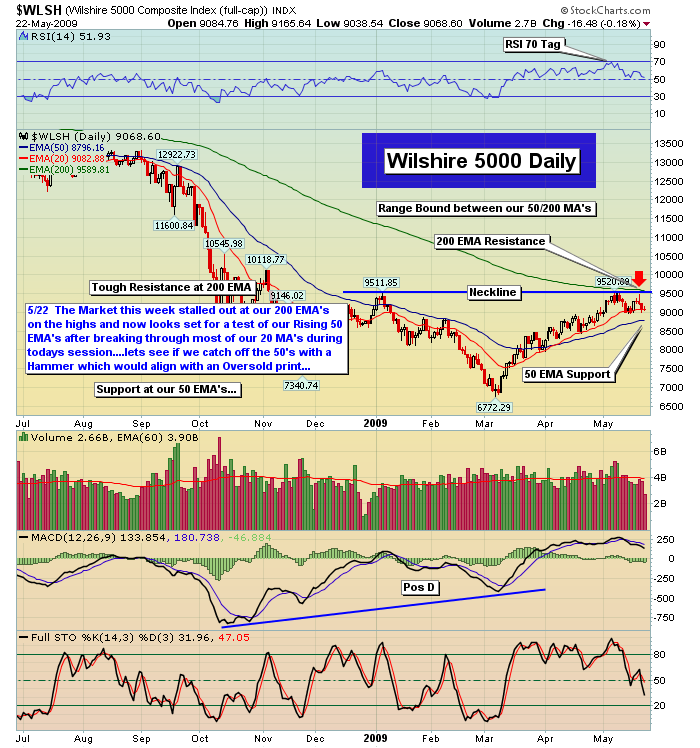
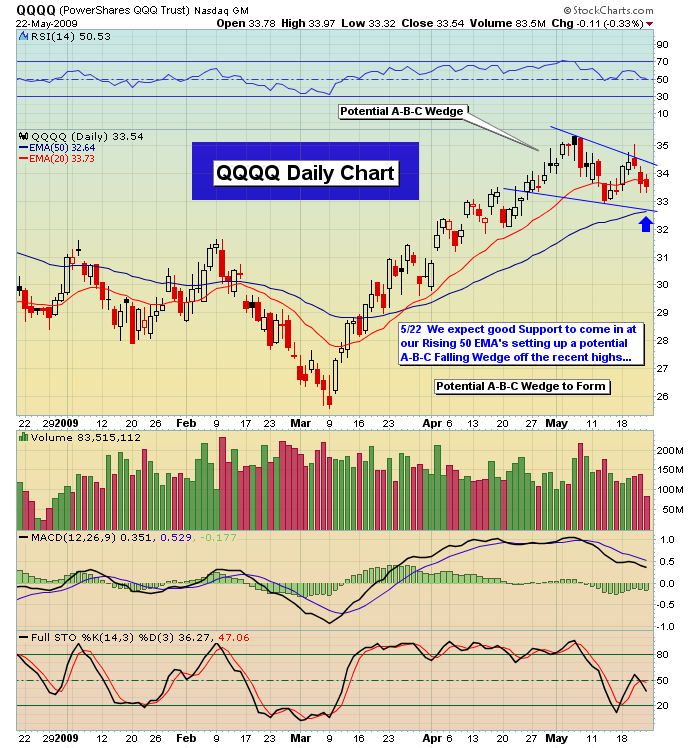
There are sectors now in some pretty bearish head and shoulders patterns such as the SOXX or the semiconductor stocks -- Semiconductor HLDRs (SMH) -- but they have yet to break their neck lines of that support. We're seeing more volume on the down side and we have those two nasty tails and a gap down off the 200 day exponential moving averages. We had that nasty reversal failure by the Nas after being thirty points above those 200's. So many things pointing to trouble potentially down the road but again, no sell signal is in place. It's also quite possible that we're still just consolidating and the market is moving down towards support after failing twice at resistance.
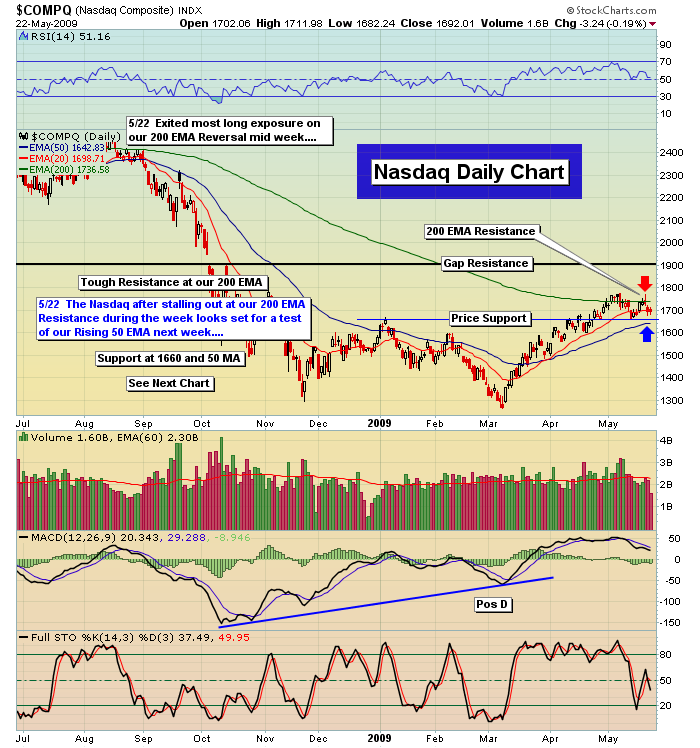
As that takes place, red flags go shooting up but that doesn't mean the market is going to break for sure. Again, heightened awareness to the possibilities as we have seen some changes in character we haven't seen since the March bottom. You want to and need to anticipate in this game to some degree naturally, but you don't want to respond to quickly either as that can lead to a lot of pain. It says go easy. it says no new longs for a while. It says stay calm in the face of a potential trend change. It tells us to simply stop what we've been doing so well with and let's see if the move down gets handled well by the bulls as they buy the 50 day test aggressively or not or if they buy Sp 875 neck line support or not. To see what type of divergences set up or not. So much to learn as we head towards support. Less is more for some days as we learn thus calm is the word until we see how things unfold.
Yesterday I spoke about how oversold those 60 minute charts were and thus it was best to just watch the action and see how well we did or did not move up off the bottom. Although we had some mild upside, we can't say anything other than the 60's still aren't bad at all. They are still basically neutral but now the daily charts are unwinding quite a bit. Makes for interesting discussion. Yes, we have a load of red flags but this is more on the bullish side of things. Was interesting, in an up day, to watch the oscillators still unwind further rather than rise on the daily charts.
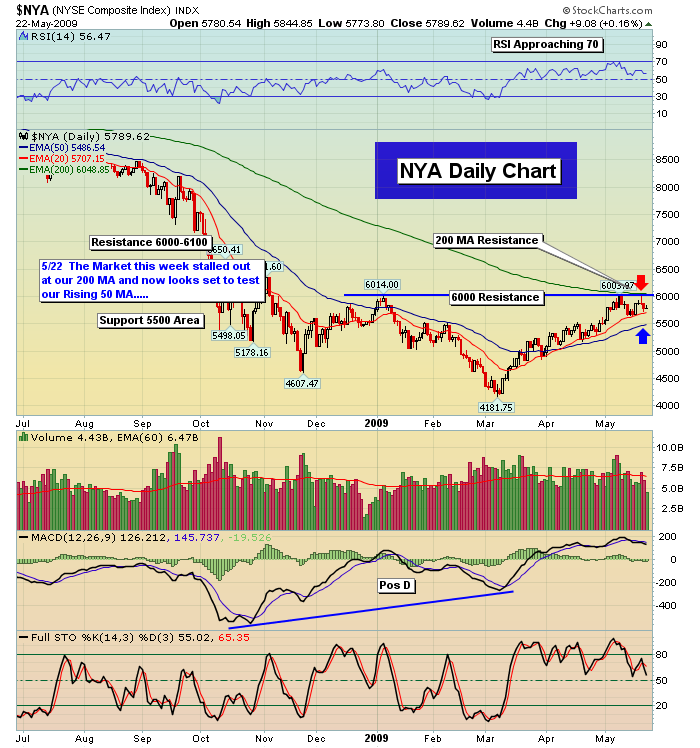
Do we really want to start thinking about shorting a market that is neutral on the short term time frame charts and getting close to oversold on the daily charts? Not what usually brings the best results if you're a bear. Mixed signals even with those red flags abounding thus the reason for no new plays at the moment so we can learn and understand more. There was some unwinding in the 60's today back up off oversold but they're not even really back to total neutrality although not oversold in this moment. Sure, we can sell further but even a little selling will bring those 60's right back down to oversold. If we get to 875 or that neck line of massive support, we will be very oversold on all time frames. If that's the case, hard to imagine it falling right away to 862 or the 50's and then break that and fall even harder. Lots of caution for both sides here.
Support levels for the Sp are 885 gap, 875 neck line and of course, 862 or the 50 day exponential moving average. A large confluence of support for sure. It is still possible that the market just needed to come down towards the 50's once it failed twice at the 200's just to unwind the daily charts and set things back up more bullish from the stand point of the oscillators. Resistance is 903 and then 929. The 200 day exponential moving average or the big breakout on the Sp is at 945 and on the Nas it's at 1736.
We now understand the defined marks of breakout and breakdown. It's whatever clears first and holds on a closing basis and does so convincingly. In between we play cautiously. If we get to the 50's, on that first test, it is likely the market would have a good spike higher. We'll play it as things set up. We've had our big run over the last few months. We we're lucky to call the bottom and make out well over that time. Now it's time for far more caution and appropriateness. I'll guide as we go.
Peace
Jack
By Jack Steiman
Jack Steiman is author of SwingTradeOnline.com ( www.swingtradeonline.com ). Former columnist for TheStreet.com, Jack is renowned for calling major shifts in the market, including the market bottom in mid-2002 and the market top in October 2007.
Sign up for a Free 30-Day Trial to SwingTradeOnline.com!
© 2009 SwingTradeOnline.com
Mr. Steiman's commentaries and index analysis represent his own opinions and should not be relied upon for purposes of effecting securities transactions or other investing strategies, nor should they be construed as an offer or solicitation of an offer to sell or buy any security. You should not interpret Mr. Steiman's opinions as constituting investment advice. Trades mentioned on the site are hypothetical, not actual, positions.
Jack Steiman Archive |
© 2005-2022 http://www.MarketOracle.co.uk - The Market Oracle is a FREE Daily Financial Markets Analysis & Forecasting online publication.