


U.S. Housing Mortgage Market Meltdown, More Pain To Come
Housing-Market / US Housing May 31, 2009 - 01:24 PM GMTBy: Mike_Shedlock

 T2 Partners has a phenomenal series of charts on the housing crisis stating Why There Is More Pain To Come.
The report is 69 pages almost all of them loaded with charts. I took a liberal selection below, adding plenty of comments, but please take a look at the original article for many additional charts. All charts below are from the article. Quotes from the article in italics. My comments are in plain text.
Case Shiller vs. Lawler
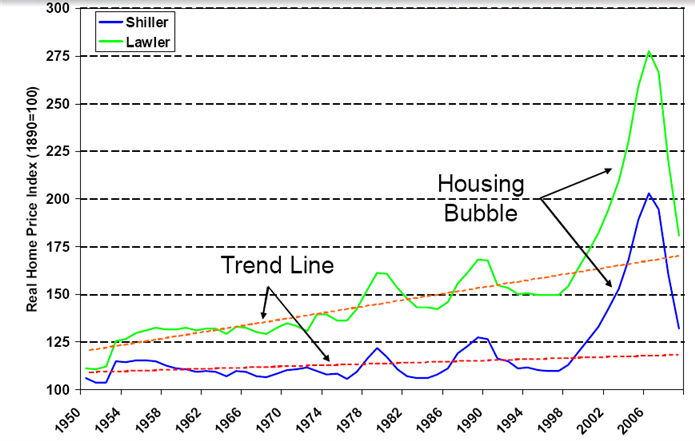
Nearly everyone is familiar with Case Shiller. I suspect most have not heard of Lawler. Interestingly there is a feud of sorts between the two as noted by the Wall Street Journal article Outlook for Home Prices Clouded by Spat Over Historical Trends.
Yale University economist Robert Shiller has often dazzled audiences with a chart showing home prices from 1890 to present. Someone even used Mr. Shiller's chart to make a YouTube video that puts its viewer on a roller-coaster ride over peaks and valleys in home pricing. It's a bumpy ride.
Now another economist, Thomas Lawler, says Prof. Shiller's chart is "bogus." Mr. Lawler says Mr. Shiller cobbled together data that are inconsistent and sometimes unreliable. Mr. Shiller defends his work and accuses Mr. Lawler of making "wild allegations."
No one has found a precise way to measure changes in house prices. Because no two homes are exactly alike, changes in the price of one won't necessarily be matched even by apparently similar homes nearby, much less those hundreds of miles away.
But that doesn't stop analysts from extrapolating from what may be dubious data. In a March 30 report, T2 Partners LLC, a New York hedge-fund manager, drew on the Shiller chart to conclude that on average U.S. home prices need to drop another 13% to get back in line with the long-term trend.
Mr. Lawler has created an adjusted version of the Shiller chart, backing up his view that house prices already are nearing a bottom in much of the country. A T2 partner called Mr. Lawler's critique "valid."I guess we need to define "nearing a bottom". We also need to look at concentrations of houses. Does it matter much if home prices are bottoming across vast sections of the farm belt with low density houses if the big cities are still declining rapidly?
Certainly we are closer to a bottom than two years ago but I am betting the bottom is still years away although the rate of decline is slowing.
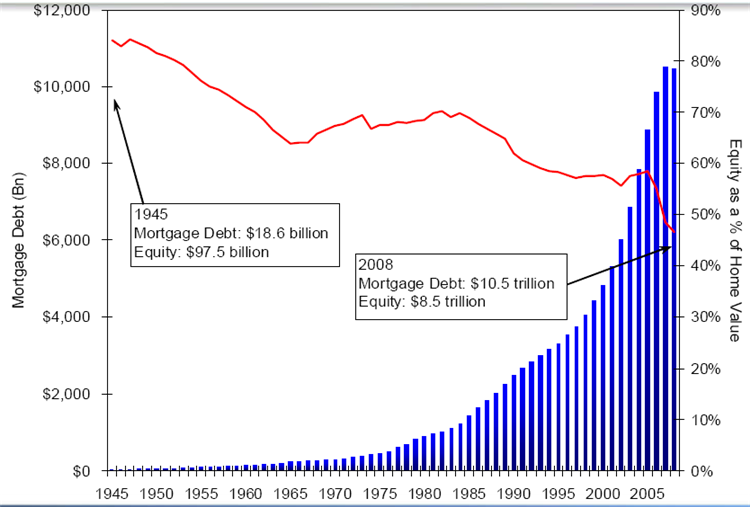
Mortgage Debt vs. Equity
Americans Have Borrowed Heavily Against Their Homes Such That the Percentage of Equity in Their Homes Has Fallen Below 50% for the First Time on Record Since 1945.
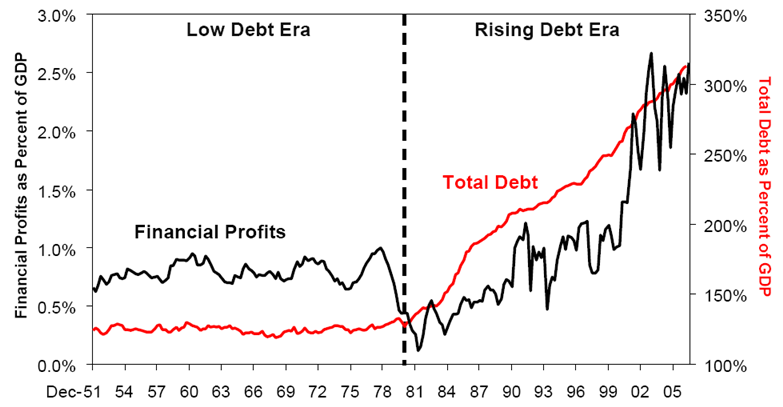
Gorged In Debt
Over the Past 30 Years, We Have Become a Nation Gorged in Debt – To The Benefit of Financial Services Firms.
Think that leverage is coming back? I don't. The Effect of Household Deleveraging on Housing, Consumption and the Stock Market is going to be far greater than most realize. This bubble will not be reblown, just as the Nasdaq bubble was not reblown after the tech crash.
Peak Credit and her twin sister Peak Earnings have arrived.
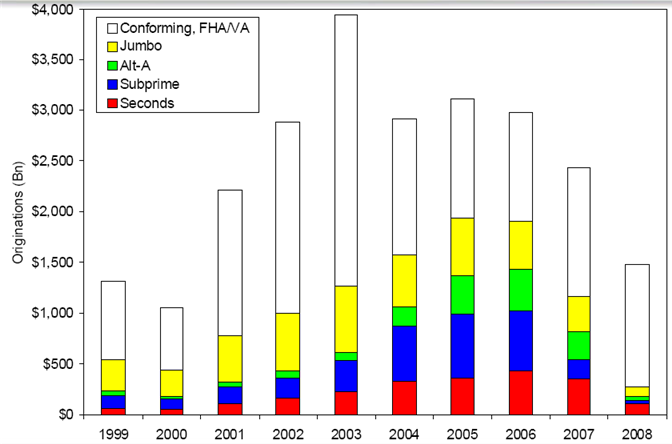
Surge of Toxic Mortgages
It took a decade to blow the bubble. It is going to take more than a few years to clear it.
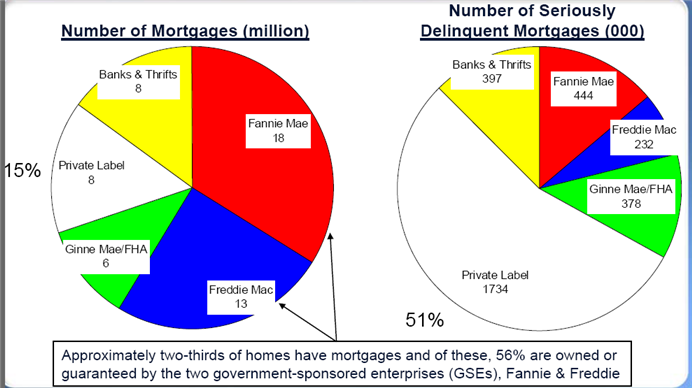
Fannie Mae and Freddie Mac Account for 56% of Mortgages
Private Label Mortgages (Those Securitized by Wall St.) Are 15% of All Mortgages, But Are 51% of Seriously Delinquent Mortgages.
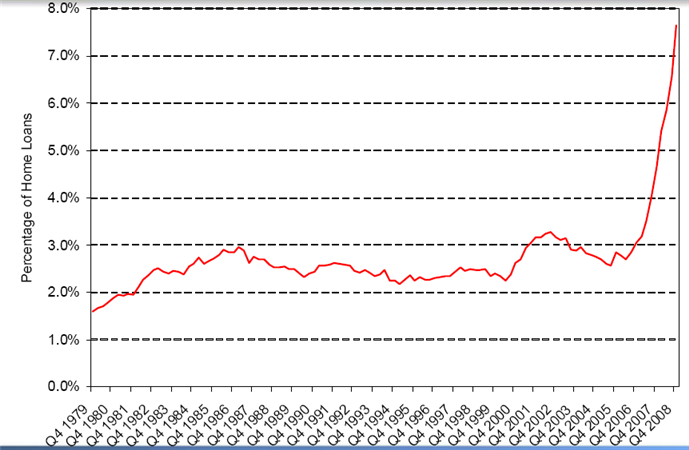
Mortgage Delinquencies as Percentage of Loans
Nearly 8% of Mortgages on 1-to-4-Family Homes Were Delinquent or in Foreclosure as of Q4 2008.
This number is bound to get much worse, and/or taxpayer bailouts get much bigger given that job losses are over 500,000 for months on end. Moreover, Fitch estimates 75 percent of the modifications now being done through the administration's Making Home Affordable program will re-default in six months to a year. Please see More Prime Foreclosures; More Re-Defaults for details.
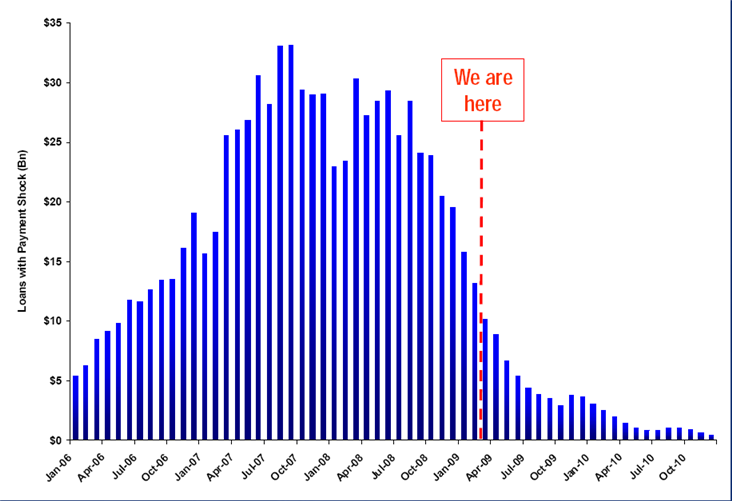
Subprime Resets
Here's the good news:
The Wave of Resets from Subprime Loans Is Mostly Behind Us.
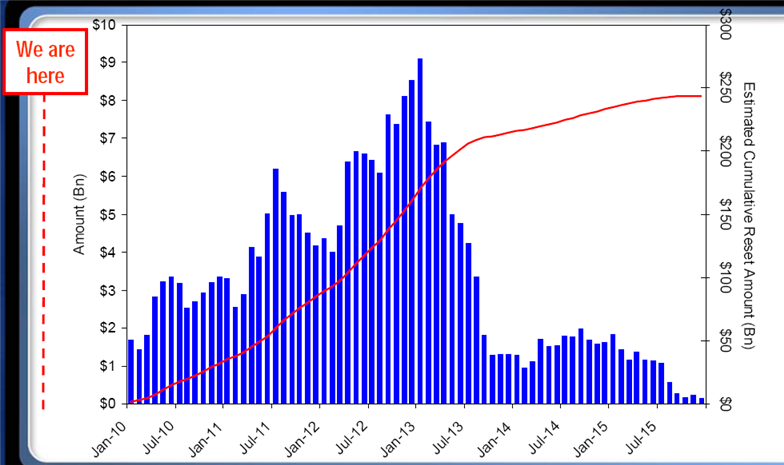
Alt-A Mortgage Resets
Here's the bad news:
There Are $2.4 Trillion of Alt-A Mortgages and Their Resets Are Mostly Ahead of Us.
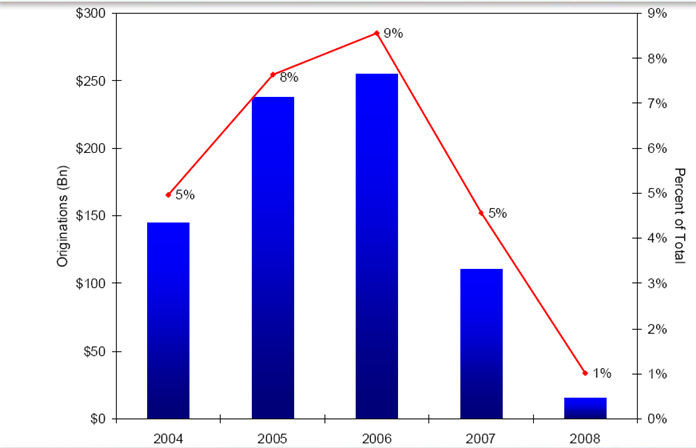
Option Arm Oiginations
About $750 Billion of Option ARMs Were Written, Nearly All at the Peak of the Bubble.
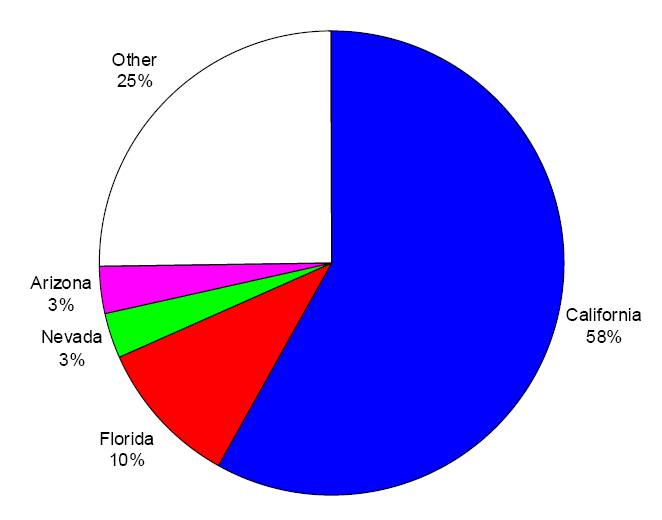
Option ARMs by State
California accounts for 58% of all Option ARMs. Think Wells Fargo, a big option ARM player is going to come out of this glowing? Warren Buffett does. I don't. Place your bets.
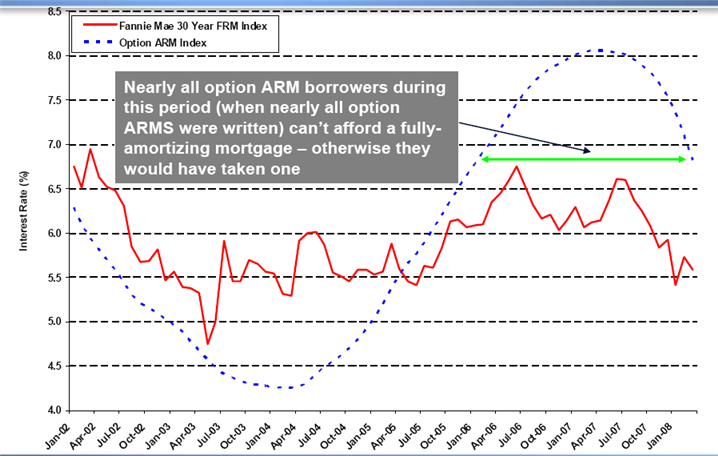
Option Arms Index vs. Fannie Mae 30 yr Index
Beginning in March 2005, High-FICO-Score Borrowers Opted for an Above-Market-Rate Option ARM in Exchange for the Low Teaser Rate
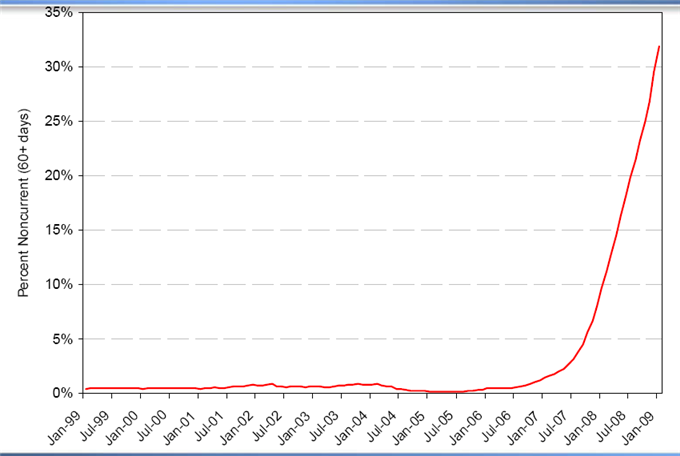
Option ARM Delinquencies
Delinquencies of Securitized Option ARMs Are Soaring
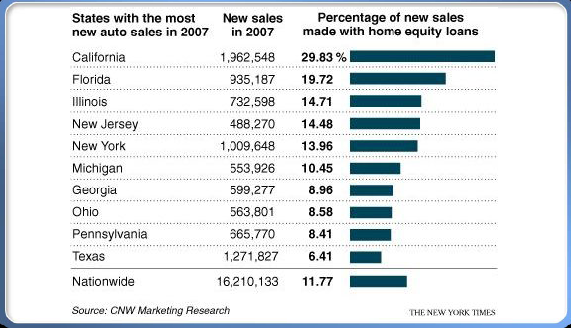
Cal Sales vs. Home Equity Loans
Think new car sales are going to come soaing back with rising unemployment and tightening loan standards? Think again.
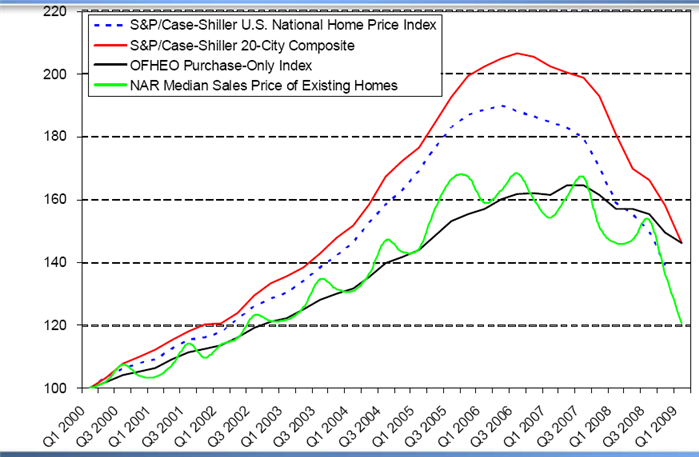
Case Shiller vs. NAR Median Sales Price vs. OFHEO Index
Home Prices Are in an Unprecedented Freefall
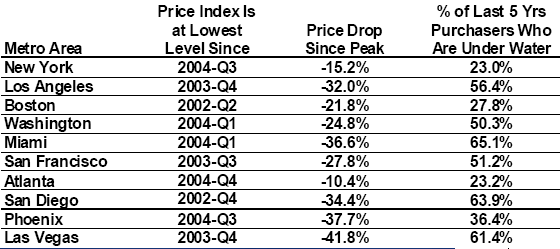
Bubble Market Declines
The bubble markets (where most people live), have taken a brutal beating.
24% of Homeowners With a Mortgage Owe More Than the Home Is Worth, Making Them Far More Likely to Default
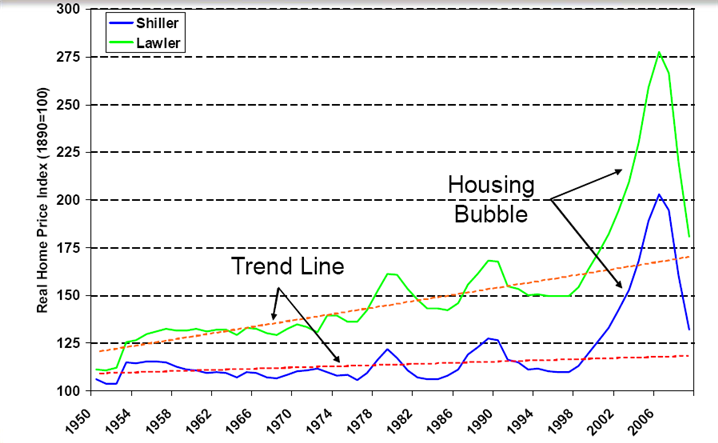
Shiller Lawler Trendlines
Home Prices Need to Fall Another 5-10% to Reach Trend Line
Whether you believe Shiller or Lawler, home prices still need to fall to reach the trendlines. Moreover there has never been a bubble correction in history that stopped right at the trendline.
Change In Nonfarm Payroll Employment
There have been job losses every month since December 2007. Moreover, there is no letup in sight as Continuing Claims Approach 6.8 Million, 17th Consecutive New Record.
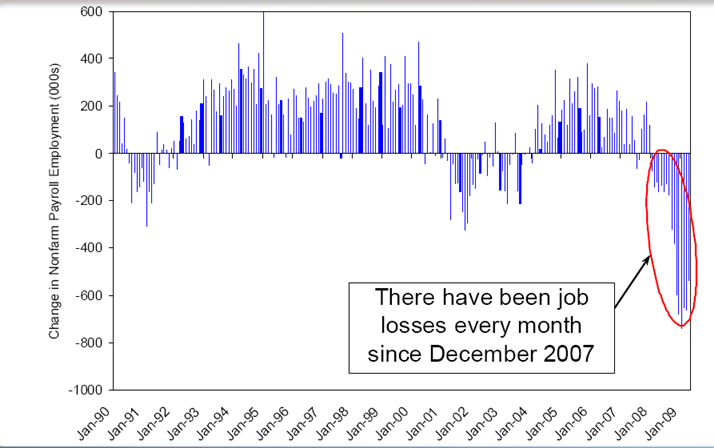
The dip in initial claims from the March peak of roughly 650,000 is not accelerating very fast, if indeed at all. Those looking for a recovery in jobs soon are going to be disappointed.
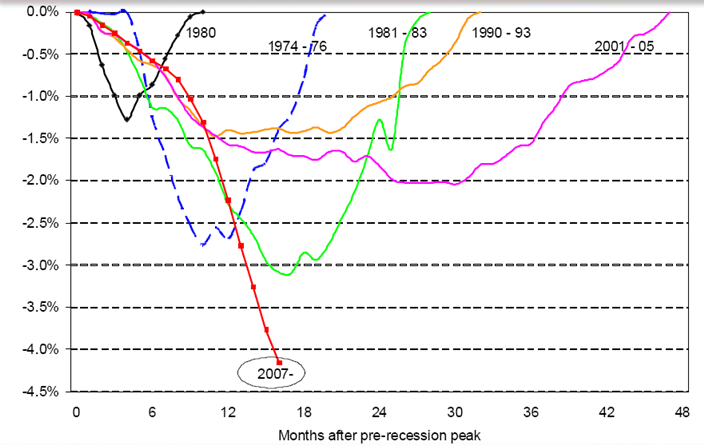
Economists expect to see unemployment by 10% at the end of the year. I expect to see it at 9.8%+- by August and approaching 11% by the end of the year. Bear in mind the "stress-free tests" conducted by the Fed had an adverse scenario of 10.3% at the end of 2010.Declines in Jobs vs. Past Recessions
The Decline from Peak Employment Now Exceeds the Past Five Recessions.
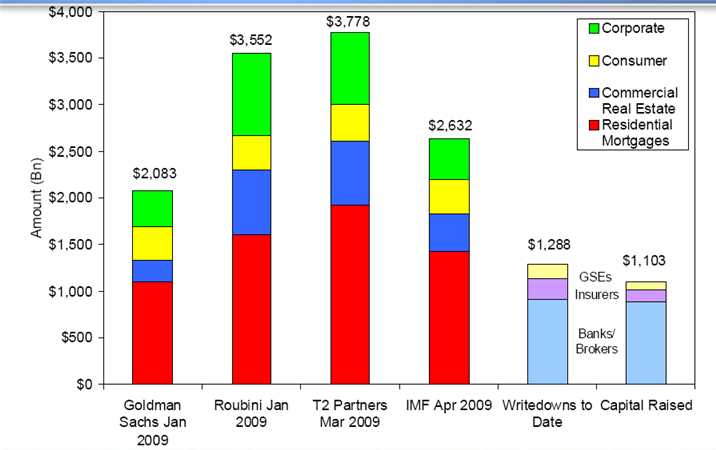
Total Bank Losses
Total Losses Are Now Estimated at $2.1-$3.8 Trillion – And Less Than Half of This Has Been Realized To Date.
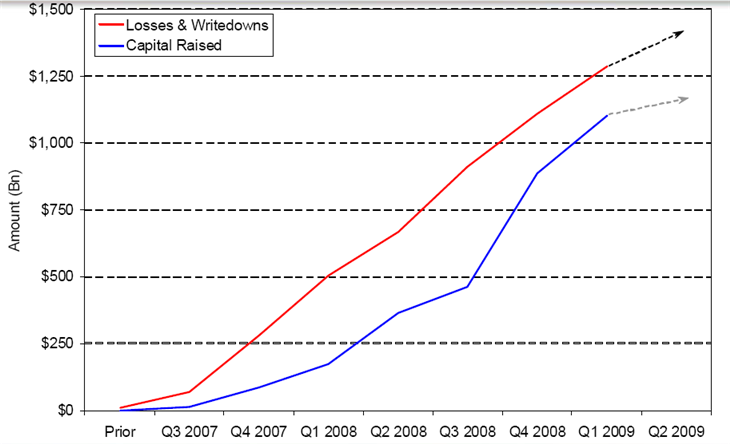
Losses & Writedowns vs. Capital Raised
Institutions Have Been Able to Raise Capital to Mostly Keep Up With Writedowns, But This Will Likely Not Continue.
What can't be paid back will be defaulted on. Consumers with no job have no chance of paying back those debts. Many others who could, won't (because it is in their best interest to walk away). The Alt-A and Option ARM defaults are going to be massive.
Think this leads to inflation? Think again.
By Mike "Mish" Shedlock
http://globaleconomicanalysis.blogspot.com
Click Here To Scroll Thru My Recent Post List
Mike Shedlock / Mish is a registered investment advisor representative for SitkaPacific Capital Management . Sitka Pacific is an asset management firm whose goal is strong performance and low volatility, regardless of market direction.
Visit Sitka Pacific's Account Management Page to learn more about wealth management and capital preservation strategies of Sitka Pacific.
I do weekly podcasts every Thursday on HoweStreet and a brief 7 minute segment on Saturday on CKNW AM 980 in Vancouver.
When not writing about stocks or the economy I spends a great deal of time on photography and in the garden. I have over 80 magazine and book cover credits. Some of my Wisconsin and gardening images can be seen at MichaelShedlock.com .
© 2009 Mike Shedlock, All Rights Reserved
Mike Shedlock Archive |
© 2005-2022 http://www.MarketOracle.co.uk - The Market Oracle is a FREE Daily Financial Markets Analysis & Forecasting online publication.