


Stock Market Rally, Topping Exhaustion Move?
Stock-Markets / Stock Index Trading Jul 19, 2009 - 05:42 PM GMTBy: Guy_Lerner

 "In the short term, there is always hope for the bulls as prices on the S&P500 remain above the down sloping 40 week moving average and above the key support level at 876. In addition, personal research shows that prices will likely move higher in the week or two after the "Dumb Money" indicator has moved from extremely bullish zone (i.e., bear signal) to neutral as it did this past week. Into this this mini - lift would be the optimal time to sell (if you haven't done so already)."
Little did I know that our "mini-lift" would result in a full blown route of the bears. The S&P500 made an intraday low at 875.32 on Monday and proceeded to move straight up for the rest of the week for a gain of 7.4%. This is the best weekly showing since the March 9 bottom. So is this the start of a new leg up or an exhaustion move?
My bet is that this will play out as an exhaustion move. This is all part of the topping process.
Prior to last week's mega-lift, the bears (or those looking for the market to rollover) were all puffed up and the bulls were demoralized. After all, the S&P500 was down 4 weeks in a row ("oh, my god") and off its recent high by some 7%. After this week, the bulls are strutting their stuff, and the bears are thinking about what is it going to take for this market to rollover. As I see it, the S&P500 remains range bound, and we are at the upper end of that price range. The markets are doing what they always do - just confounding the bears and the bulls.
But for all its effort, the S&P500 is right back where it started some 11 weeks ago when the "Dumb Money" indicator first made an extreme bullish (i.e., bear signal) reading. The "Dumb Money" indicator is shown in figure 1. The "Dumb Money" indicator looks for extremes in the data from 4 different groups of investors who historically have been wrong on the market: 1) Investor Intelligence; 2) Market Vane; 3) American Association of Individual Investors; and 4) the put call ratio.
Figure 1. "Dumb Money" Indicator/ weekly
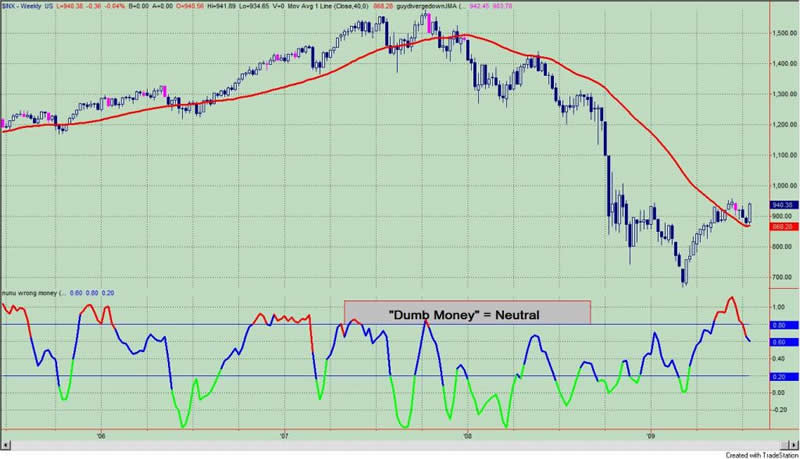
What about last week's big gains? What does that mean? Within the context of investor sentiment, last week's strong price move is more likely an exhaustion move than the start of another leg up. Typically, such strong up moves occur with the "Dumb Money" indicator much more bearish on equities.
The only thing I cannot rule out is a melt up or what I like to call the "this time is different" scenario. I previously mentioned that I have defined the "this time is different" scenario as a weekly close over the high of a negative divergence bar. Negative divergence bars between price and momentum oscillators that measure price indicate slowing upside momentum. In anticipation of a market top, traders will take positions as these negative divergence bars begin to appear. My research shows that a weekly close over the highs of a negative divergence can lead to an accelerated price move, and it is my belief that this is due to short covering as traders cover losing positions. The bulls say, "Yeah, I told you so. This time is different." But usually it rarely is.
On the QQQQ or ETF proxy for the NASDAQ 100, the "this time is different" scenario is clearly in effect. The weekly close over the 36.50 level puts this scenario on the table. The same is true for the SPY or ETF proxy for the S&P500; the SPY closed at 94.13 and the trigger for the "this time is different" scenario was a weekly close greater than 94.02.
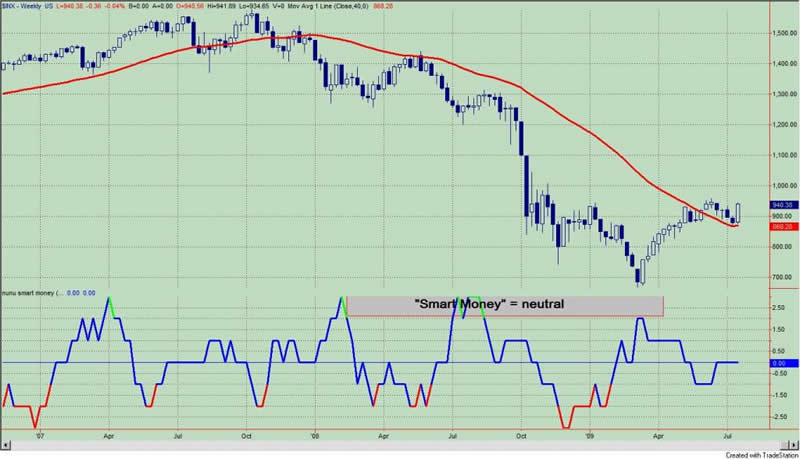
The "Smart Money" indicator is shown in figure 2. The "smart money" indicator is a composite of the following data: 1) public to specialist short ratio; 2) specialist short to total short ratio; 3) SP100 option traders. The "smart money" is neutral.
Figure 2. "Smart Money" Indicator/ weekly
By Guy Lerner
http://thetechnicaltakedotcom.blogspot.com/
Guy M. Lerner, MD is the founder of ARL Advisers, LLC and managing partner of ARL Investment Partners, L.P. Dr. Lerner utilizes a research driven approach to determine those factors which lead to sustainable moves in the markets. He has developed many proprietary tools and trading models in his quest to outperform. Over the past four years, Lerner has shared his innovative approach with the readers of RealMoney.com and TheStreet.com as a featured columnist. He has been a regular guest on the Money Man Radio Show, DEX-TV, routinely published in the some of the most widely-read financial publications and has been a marquee speaker at financial seminars around the world.
© 2009 Copyright Guy Lerner - All Rights Reserved
Disclaimer: The above is a matter of opinion provided for general information purposes only and is not intended as investment advice. Information and analysis above are derived from sources and utilising methods believed to be reliable, but we cannot accept responsibility for any losses you may incur as a result of this analysis. Individuals should consult with their personal financial advisors.
Guy Lerner Archive |
© 2005-2022 http://www.MarketOracle.co.uk - The Market Oracle is a FREE Daily Financial Markets Analysis & Forecasting online publication.