


Which Stocks and Sectors Will Lead the Economic Recovery?
Companies / Investing 2010 Mar 08, 2010 - 07:25 AM GMTBy: Money_Morning

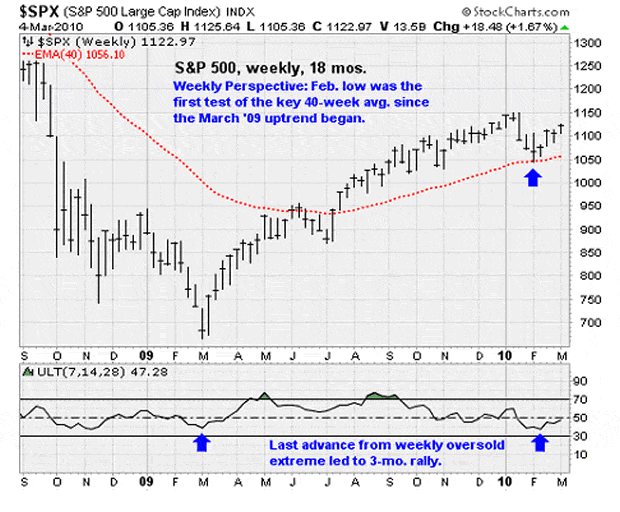
 Jon D. Markman writes: A lot of my commentary lately on the markets has been relatively short-term oriented. Today let's take a moment to pan back and consider the weekly perspective, which is rather benign, even positive.
From this point of view, stocks are broadly recovering from their most oversold condition since March of last year -- and the release of the energy stored up then persisted at near-full strength for three months.
Top performing sectors have been basic materials and retailers. The latter is the most important because it's the most surprising to most people - and because it's been my top recommendations in the past month through SPDR Retail (NYSE: XRT). The good news was reinforced this week with a report on February sales that shocked the pessimists. On a day when the broad market rose only 0.4%, the XRT jumped 1.9%. Teen retailer Abercrombie & Fitch Co. (NYSE: ANF) leapt 14.5% to within an eyelash of its one-year high, and many companies that supply stores, like my recommended game maker Hasbro, Inc (NYSE: HAS), jumped to new highs as well. You can never underestimate Americans' love for shopping, no matter what their condition.
Let's linger here a moment, because it's really important to understand why retail is winning at a time when very few believe it is possible. The reason is the same that we talked about many times last year when the question turned to why any companies were doing well at all in an environment that was expected to be terrible.
I said back then that public companies outperformed because they didn't just sit on their hands and watch their world collapse. They adapted. They laid off workers. They closed plants. They got smaller and leaner and tougher. They used the magic of operating leverage to make great profits on smaller revenue bases. And that's why 2009 turned into such a rout for bears.
Now look at the retail report that was published on Thursday, and what do you see? Retailers knew that they faced a tough year if they just kept doing what they had always done, so they adapted. They closed underperforming stores. They cut employees' hours. They got more productivity out of remaining workers. They cut their inventories. They stopped discounting. They pushed more of the sales pipeline burden onto their wholesalers. In a word, they adapted.
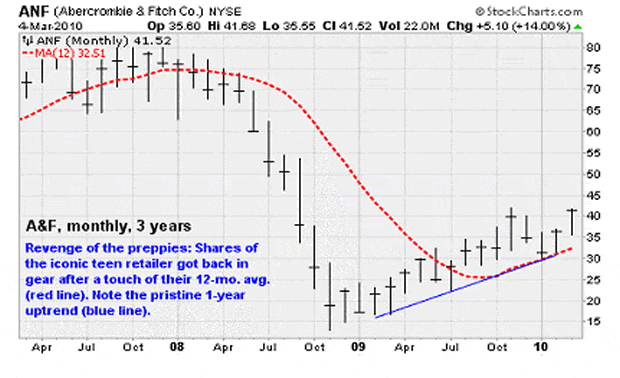
One of the more remarkable reports was turned in by Abercrombie & Fitch, which many retail experts had written off as out of touch with current teenagers who were snubbing the look of ritualistic logos and preppy sensuality. Analysts expected ANF to post a 6.9% decline in same-store sales, and instead they came up with a whopping 5% increase. Ken Perkins, president of Retail Metrics, told reporters: "Retailers have really done a great job of limiting their inventories, so they weren't stuck with a lot of stuff that they had to drastically mark down."
Of course one reason sales looked good was that they were being compared to levels of a year ago during the worst of the recession. And sober-sided analysts at Moody's told clients that they remained unconvinced that retailers' results were sustainable. But when you consider that malls on the east coast were closed, snowed in for half a week, and yet shopping centers as a group still posted a year-over-year 3.7% increase in traffic - the best since 2007 - it just has to catch your eye.
I've been mentioning that discounters were faring best, and that certainly was the case in the market on Thursday. Ross Stores, Inc. (NASDAQ: ROST), which I highlighted earlier in the week, jumped another 3.35% to a new all-time high. And Amazon.com, Inc. (NASDAQ: AMZN), which had been in a funk, rose 2.1% and finally edged above its 50-day average for the first time in more than two months. According to Markethistory.com data, when in the current technical configuration (above its 200-day and 50-day averages on March 4), AMZN has risen in four of the past four instances by an average of 26% over the next 10 weeks. (Caution: Its recent large five-day gain will limit near-term upside.)
Bottom line: While it's true that the consumer isn't dead yet despite stagnant wages, non-existent job growth, falling home values and declining credit levels, the real story here is that retailers did a great job of adjusting their businesses to meet the challenge.
Blow-ups and Buyouts
I always keep a close watch on new highs and new lows every day, because those stocks are on the vanguard of winning and losing sectors.
One of those new lows last week illustrates why I hardly ever recommend small biotech stocks. Medivation (NASDAQ: MDVN) was shot out of the sky after its Alzheimer's disease therapy was found to have no effect in late-stage clinical trials compared to a placebo. What kills you about biotech stocks is that their stories are always so awesome that they're hard to resist. MDVN had its Dimebon drug validated via a partnership with drug giant Pfizer, Inc. (NYSE: PFE), and in a previous trial some experts said it had produced better results than any of the drugs already approved for treating Alzheimer's. The New York Times reported that as recently as two weeks ago, an Alzheimer's researcher had said of Dimebon, ''The clinical data is by far and away superior to anything that's ever been shown before.''
Of course that researcher just happened to be a Medivation consultant, that prior trial was done in Russia under somewhat suspicious circumstances, and not even Pfizer was exactly sure how the drug worked. And yet MDVN shares had steadily risen three-fold since December 2008. It's back there now after falling 67% on Wednesday and another 7% on Friday, mostly in a gap from which there was no escape.
On the plus side of the ledger this week were more deals. Southwest Water Co. (NASDAQ: SWWC) jumped 46% after it said it would go private, and enterprise networking products maker Novell, Inc (NASDAQ: NOVL) rose 28% after receiving a buyout bid from a private equity fund.
What I want you to notice in both cases is that the companies were both in boring, low-growth fields and frankly have undistinguished product lines and earnings records. But they are reliable cash generators, and super-cheap, and that makes them attractive to the right buyers. That is almost exactly the scenario that I was describing on Tuesday night in reference to a recently recommended storage device maker Quantum Corporation (NYSE: QTM). If you want to read more about QTM's prospects from an enthusiastic owner, check out this article at Seeking Alpha by veteran value investor Joe Feshbach.
StrataGem Focus: Cognizant Technology Solutions
Every month I launch a new set of 10 stock picks made by my proprietary StrataGem model, and our new group for March got off to a good start this week, rising 5.2% as a group, about double the broad market.
For those of you who have never seen my service, a quick explanation: StrataGem is a stock-ranking system that I developed nine years ago in the middle of the tech bear market. In the prior ten years, investors had grown enamored with fundamental analysts and a mere upgrade of a stock could send it flying. But in 2000 the cover started to come off the ball, and underneath the brokerages' glitzy exterior turned out to be a rotten network of good old boys bulling unworthy companies for the benefit of their investment-banking clients. Shocker, I know -- who'd a thunk.
StrataGem is a "statistical arbitrage" system that uses a set of mathematical formulas to try to find the fastest growing companies with the lowest valuations that are likely to rise in the next one to six months with the lowest volatility. After all stocks are ranked from high to low, the system then determines which are in sectors, market capitalization groups or valuation groups that are the most likely to rise over the next one to six months.
So the stocks we present as the top 10 should be among the fastest growing, least expensive and least volatile in the market. It's obviously not right every month, but usually wins in eight out of twelve months. Last year the set of ten were up, as a group, in nine months (results here). The bulk of the gains came in March and April, though July, October and December were very good too. It's notoriously hard to determine how well a "stat-arb" system will do in any given month. Last year was a great example: March saw the group rise 13.2%, but the prior month was down 5% and the first week of that month was horrific. So you just have to mechanically buy every month if you follow this path. Members decide for themselves how much of their personal portfolios to devote to StrataGem; depending on their situation, around 15% to 25% can be appropriate.
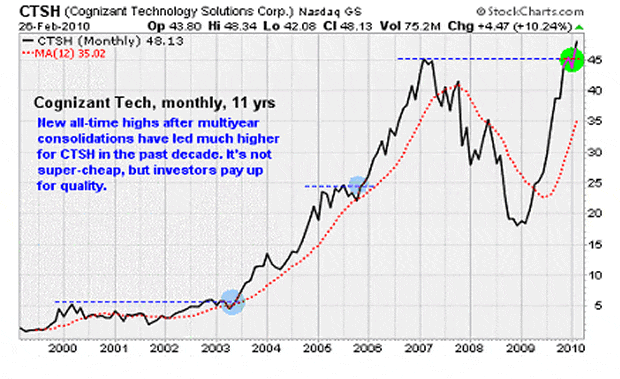
The largest member of the new March StrataGem list is Cognizant Technology Solutions Corp. (NASDAQ: CTSH), which is a leading offshore provider of information technology services to big companies. It's based in the United States, but is considered by most to be an Indian company since most of its operations are there.
It has been a major beneficiary of globalization, as revenue has risen 50% on average over the past five years -- a stunning number. Analysts applaud its consultative approach to solving clients' problems and ability to increase its share of clients' business by delivering consistent cost savings.
In the fourth quarter of 2009, the company reported 20% revenue growth over the previous year and a 9% boost over the previous quarter. Jefferies & Co. analysts noted that the company's 20% operating margin remains a "substantial buffer to any unexpected cost pressures," which in English means that if its input costs rise it can still hit earnings estimates by cutting costs.
The Jefferies team is looking for earnings per share to grow 13.5% this year to $2.02 before expanding another 16% in 2011. This is one of the most successful companies in the world over the past decade, and emerging from a three-year consolidation. CTSH has been on our list twice in the past year, recommended at $30 and $38.60. Now it's $48.15. The model likes it long and the daily chart looks good. Still a buy on pullbacks.
Where's the Volume?
A lot of investors have been wondering why trading volume appears to be so low during the past year's really -- particularly on up days. And now maybe we have an answer.
Analysts at Lowry's Reports Inc. in Florida observed that the lack of volume in the rally over the past 11 months does represent an anomaly for a primary market uptrend. NYSE volume peaked in early April 2009, about a month after the bear-market bottom, and has been coming down since. In the past eight decades of data, Lowry's has not seen another instance when volume began to drop so early and consistently in a new primary market uptrend.
Yet further research suggests this may not be as negative as it sounds. Lowry's notes that the use of margin borrowing reached its apex in the latter stages of the 2003-2007 bull cycle, with many institutional traders leveraged 40-1 or more. Leverage then crashed during the bear market, and has only picked up at a very moderate pace in the recent up move. So the lighter volume may simply reflect the reduced use of borrowed money rather than a lack of demand.
Lowry's also observes that its primary measure of demand is not absolute levels of volume, but the intensity of the purchase or sale of shares as measured in its Buying Power and Selling Pressure indexes. By these measures of intensity, demand has been steadily rising to new highs and supply has been falling steadily to new lows as recently as Friday. Therefore they conclude that the decline in volume has not reflected a lack of demand.
Moreover there have been analysts -- including, ahem, myself -- who have mentioned that volume appears much higher on down days than on up days. Lowrys says the data does show that's true, but by a very small margin. In the 26 trading days from the January 19 high to February 25, NYSE volume has averaged 5.1 billion shares on down days and 4.7 billion shares on up days -- a pretty small difference. Yet Lowrys goes on to note that NYSE Down Volume has averaged 71% of total volume on down days while up NYSE Up Volume has averaged 72% of total volume on up days.
This analysis suggests that big investors are not sneaking out of the market, as they would do if they anticipated a major top were at hand. It seems time, then, to put the volume argument out to pasture as a reason to fear the market at the current levels.
The Week in Review
Monday: The ISM Manufacturing Index continued to indicate month-over-month growth for the manufacturing sector. The index came in at 56.5 versus the 57.5 consensus estimate ant the 58.4 prior reading. Any level over 50 indicates expansion.
New orders remain strong but moderated somewhat by falling to 59.5 -- ending a string of 60-plus readings. Backlogs were a big area of growth, expanding 5 points to 61. The narrative here is the production managers are still cautious, waiting until the last minute to hire new works and expand production to meet new orders. As a result, backlogs are growing. Eventually, for fear of losing out to competitors, new workers will be hired.
Tuesday: Motor vehicle sales were remarkably resilient in February despite a bout of severe winter weather and the ongoing accelerator pedal debacle at Toyota. Sales came in at a 7.6 million annualized rate. This was just below the consensus estimate and prior month's figure of 7.9 million.
Wednesday: The ISM Non-Manufacturing Index, which measures the activity in the all-important services sector, jumped to 53 in February -- signaling solid month-to-month growth for the majority of the U.S. economy. This was well ahead of the consensus estimate of 51 and the period month's 50.5 result. New services orders increased to 55 -- the best rate of month-to-month growth seen since August 2007.
Thursday: Retailers reported impressive sales figures for February despite severe winter weather. In fact, Retail Metrics noted that its same-store sales index rose 4.1% in February against a 3% forecast. This is the biggest monthly gain since November 2007. Overall, 82% of retailers beat sales expectations, and this helped push retail stocks up in a big way.
It's also important to note that factory orders increased in January, while weekly initial jobless claims dropped slightly. But offsetting the good news was a dour pending existing home sales report. This is yet another data point showing that housing succumbed to a serious drop in activity in the wake of the expiration of the now extended first-time homebuyer tax credit.
Friday: Investors reacted favorably to a better-than-expected February jobs report. And by "better" I mean less bad than pessimists had feared. Employers still cut 36,000 jobs, but the unemployment rate stayed at 9.7% despite the severe winter weather seen during the month. Philippa Dunne of the Liscio Report had this to say about the numbers:
"All in all, it looks like the labor market continues to stabilize, but it's not really turning around. We think it would be a mistake to write off this month's employment numbers as nothing but a weather report; there's very little evidence for that. The labor market continues to behave in a fashion typical of post-financial-crisis recessions, a sharp fall followed by extended flatness."
The Week Ahead
Monday: A couple of Treasury bill auctions.
Tuesday: A few more Treasury auctions. Brazilian energy giant Petroleo Brasileiro SA (NYSE ADR: PBR) reports earnings.
Wednesday: U.S. Treasury Budget and a 10-year note auction. Watch the yields on 10-years to see if long-term interest rates are headed higher as investors prepare for the end of the Federal Reserve's direct mortgage purchases.
Thursday: An update on the U.S. trade balance and weekly initial jobless claims will be reported.
Friday: Reports on retail sales, consumer sentiment, and business inventories. Cytori Therapeutics (Nasdaq: CYTX) reports earnings at 7 a.m. ET.
Soure: http://moneymorning.com/2010/03/08/stock-sector-performance/
Money Morning/The Money Map Report
©2010 Monument Street Publishing. All Rights Reserved. Protected by copyright laws of the United States and international treaties. Any reproduction, copying, or redistribution (electronic or otherwise, including on the world wide web), of content from this website, in whole or in part, is strictly prohibited without the express written permission of Monument Street Publishing. 105 West Monument Street, Baltimore MD 21201, Email: customerservice@moneymorning.com
Disclaimer: Nothing published by Money Morning should be considered personalized investment advice. Although our employees may answer your general customer service questions, they are not licensed under securities laws to address your particular investment situation. No communication by our employees to you should be deemed as personalized investment advice. We expressly forbid our writers from having a financial interest in any security recommended to our readers. All of our employees and agents must wait 24 hours after on-line publication, or 72 hours after the mailing of printed-only publication prior to following an initial recommendation. Any investments recommended by Money Morning should be made only after consulting with your investment advisor and only after reviewing the prospectus or financial statements of the company.
Money Morning Archive |
© 2005-2022 http://www.MarketOracle.co.uk - The Market Oracle is a FREE Daily Financial Markets Analysis & Forecasting online publication.