


Gold, Stocks and Falling Inflation Producer Price Index
Stock-Markets / Financial Markets 2010 Mar 18, 2010 - 01:11 AM GMTBy: Steve_Betts

 The Producer Price Index (PPI) fell a large 0.6% in the month of February, twice the projected decline. The poor performance was blamed on declining oil prices, but if the crude oil futures pit is to be believed, the April contract opened the month of February at 74.91 and closed out the month of February at 79.66. That’s a gain in my book! Of course there is nothing to worry about since the “core” number, excluding food and energy, still rose by 0.1%.
That’s all well and good, but how many of you can live without food and energy? Only the government could come up with such a concoction. The other big news item was the Fed’s decision to leave rates unchanged for an “extended period of time”. Who would have guessed that? They also mentioned that they would end the asset purchase program by the end of the month as planned. And by the way, there are no worries about inflation! Again, who would have guessed that? I suppose the Fed has no choice but to end the program since their balance sheet is bloated with hundreds of billions of dollars of worthless assets.
With respect to the long awaited recovery in the housing market, it took a step backwards yesterday as it was announced that housing starts fell by 5.9%, to 575,000 in February. Starts for large condos and apartment buildings plunged a large 43%!
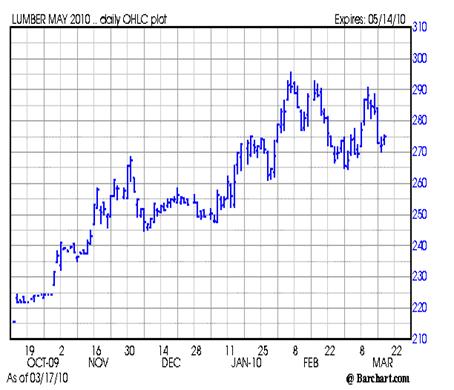
I have been watching the rise in the price of the May lumber futures contract for months in an effort to determine a price at which I can short the market. Recently the price of lumber made two lower highs and maintains itself below what was good support at the 280.00 level. This morning the May contract is trading at 275.10 and I sold it short at 275.00. I will only exit if and when I see a close above 281.00. Given the continued slow down in the US economy, the fact that banks are not loaning money, and the continued high rate of unemployment, I do not see how housing can improve anytime soon. That means lumber prices must fall.
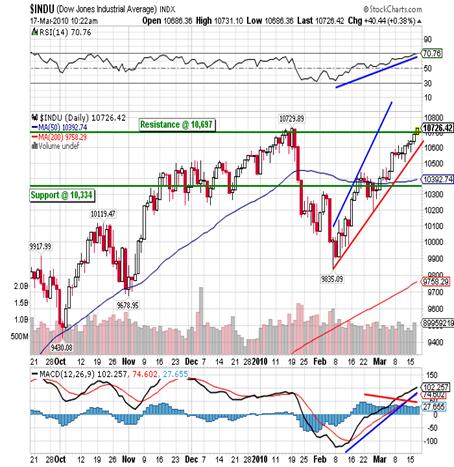
Right now the Fed’s battle to “inflate or die” is being carried out in the stock market. This morning the Dow made a new intraday high, moving above the January intraday high by three points, and is currently trading at 10,726 which would be a new closing high. We are obviously a long way from the close, but the Dow has slowly clawed its way higher for the last week and has been in rally mode for more than five weeks as you can see in this chart:
Over the last six sessions the Transports have made consecutive new closing highs in each and every one, and none of them have yet to be confirmed by the Dow. This morning the Transports are actually trading down 4 points at 4,370 at 10:30 am EST.
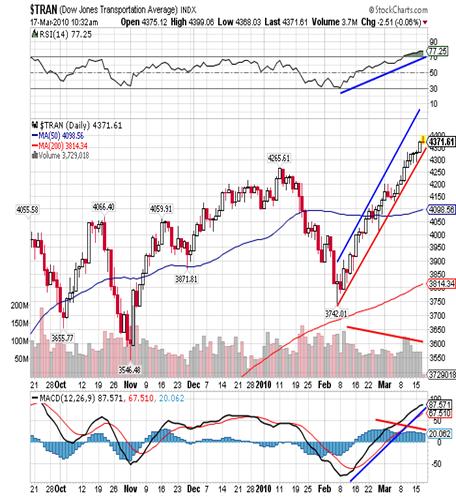
As you can see both the Transports and Dow are extremely overbought and, in both cases, the histogram has started to decline. Also, in both cases we see that volume continues to decline as the reaction runs its course. This indicates that large investors are sitting on the sidelines. Finally, in the Dow’s daily chart I drew in a resistance at 10,697 which is the 50% retracement from the 2002 low, back up to the 2007 bull market top. This is strong resistance and given the fact that the S & P has a PER of 22 and an average dividend yield of 1.90%, I fail to see how the Dow can advance. Then again it doesn’t matter what I see or I don’t see; it only matters what the market does. If the Dow does manage to confirm with a close above 10,725.43, I will immediately reverse and go long. If the Dow turns down, I will add on to my short position with any close below 9,908.39. Until then there is nothing to do but watch.
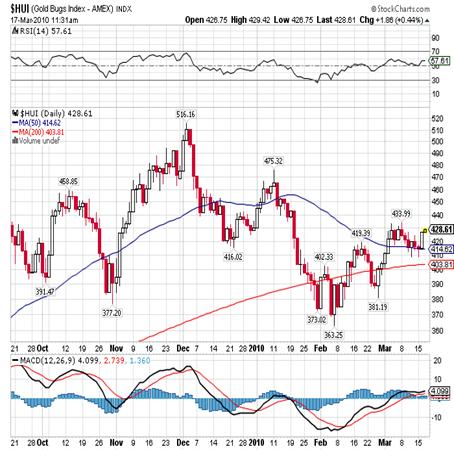
Finally, gold made a half-hearted attempt to test strong resistance at 1,136.70 early this morning, trading as high as the 1,133.90 in the April gold futures contract (and below the spot gold high of 1,134.40 I might add). Gold was immediately hit hard on the news of the poor PPI numbers, not that an excuse is ever needed, and is currently trading down 1.50 at 1,124.40. This is to be expected as volatility increases with each passing week. Also, it will take time to determine that a top in the dollar has in fact been reached. April gold has good support at 1,117.50 and below that we’ll find even stronger support at 1,105.60 level. In spite of the moment-ary weakness in gold, the HUI remains in positive territory as it hovers right around critical resistance at 427.32. Right now the HUI is a point above this resistance (at 11:40 am EST) but we are a long way from the close. It is also worth mentioning that the HUI’s Point & Figure chart (not shown) has a bullish price target of 464.00. I remain very bullish on gold over the medium and long term while I am neutral over the short run.
By Steve Betts
E-mail: team@thestockmarketbarometer.com
Web site: www.thestockmarketbarometer.com
The Stock Market Barometer: Properly Applied Information Is Power
Through the utilization of our service you'll begin to grasp that the market is a forward looking instrument. You'll cease to be a prisoner of the past and you'll stop looking to the financial news networks for answers that aren't there. The end result is an improvement in your trading account. Subscribers will enjoy forward looking Daily Reports that are not fixated on yesterday's news, complete with daily, weekly, and monthly charts. In addition, you'll have a password that allows access to historical information that is updated daily. Read a sample of our work, subscribe, and your service will begin the very next day
© 2010 Copyright The Stock Market Barometer- All Rights Reserved
Disclaimer: The above is a matter of opinion provided for general information purposes only and is not intended as investment advice. Information and analysis above are derived from sources and utilising methods believed to be reliable, but we cannot accept responsibility for any losses you may incur as a result of this analysis. Individuals should consult with their personal financial advisors.
© 2005-2022 http://www.MarketOracle.co.uk - The Market Oracle is a FREE Daily Financial Markets Analysis & Forecasting online publication.