Gold Potential to Hit $2,000 to $3,000 Within 2 Years
Commodities / Gold and Silver 2010 Apr 28, 2010 - 12:23 AM GMTBy: Aden_Forecast
 This month’s jump up in precious metals, resources and oil reinforces that the lows in February were likely the lows for the downward correction.
For now, the second quarter is off to a good start. The fact that gold’s decline was mild (down 13½%) is saying that the underlying bull market is strong and solid. You should now have your positions bought and in place, waiting for the bull market to further unfold.
Platinum and palladium have been strong, reaching new highs and they seem to be leading gold, silver and the metals shares in another leg up in the bull market. In fact, the new highs in many commodities reinforces this.
BIG PICTURE INVESTING BEST
Many of you know the importance we place on the big picture. The big picture is most important, and knowing where the mega and major trends lie is a key to good investing.
Our main goal has always been to invest in the major trends and to stay with them. We can’t stress this enough because over the years we have found that more money can be made this way, rather than trading the intermediate moves.
 Sometimes trading works well and when it does, it’s great. But unless you’re prepared to devote a lot of time to trading, or follow the advice of a good, professional trader, then it’s easy to make mistakes. This usually happens when an investor becomes too emotionally involved.
Most frustrating is that a major move can be missed because you’re too busy trading a correction. And remember, the major moves are where your focus should be. They’re
the most profitable.
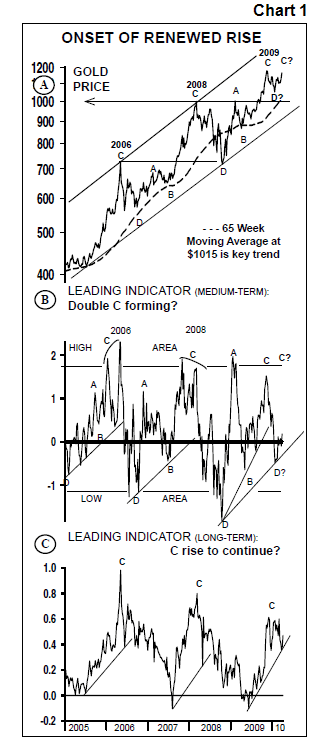
The latest downward correction in the gold price provides a good example of what we mean. We called this a ‘D’ decline and they tend to be steep.
Since 2001, these recurring D declines have ranged from a loss of about 7% to nearly 30%. The November to February correction lost 13½%. This was moderate compared to the last two D declines in 2006 and 2008, which were down 22.16% and 29.80%, respectively, and were the steepest so far (see Chart 1A).
We always receive many letters regarding our leading indicators and this is one of our favorites (Chart 1B). We know that gold’s major trend is up, meaning it’s headed higher. But within this uptrend there are intermediate ups and downs, and this indicator works
well in identifying these ebbs and flows within gold’s bull market.
Currently, for instance, the gold price and the leading indicators are starting to rise. This tells us that a renewed rise is beginning. But if you were waiting for further gold weakness before buying more, then the market is slipping away and you’re already missing out on part of the renewed strength.
This is why it’s best to buy during weakness when possible, but not to try and get the low. Averaging in during weakness is the ideal way to buy, and a big picture approach
makes it easier to just jump in and buy at any time.
For now, gold looks ready to spring forward. Considering that just six months ago, the $1000 level was a super break out point and today it’s a major support level illustrates how gold’s slow and steady rise has been gaining momentum.
The gold price has broken above all resistance and the last remaining one is the November closing high at $1218. Once $1218 is surpassed, gold could jump up to the $1300 level before this intermediate rise is over.
GOLD’S POTENTIAL
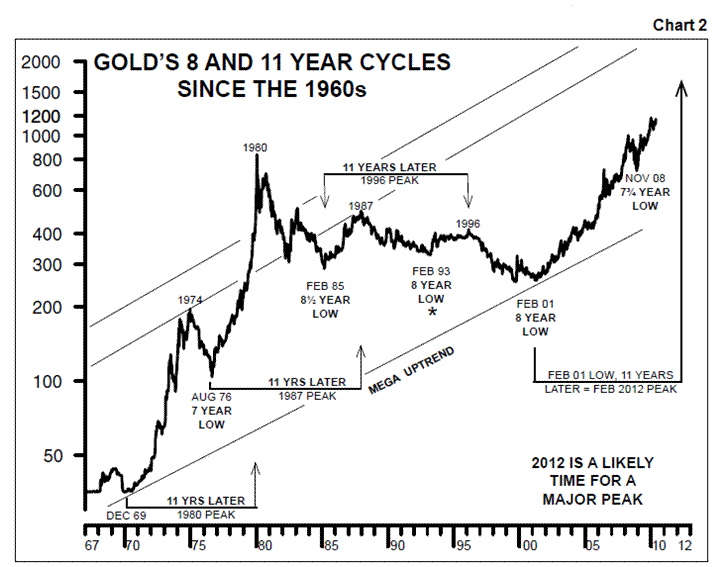
This means that the bull market remains very strong, even though gold’s already been rising for nine years. Chart 2 shows gold’s big picture since 1967 when it began to move in the free market.

Here you can see an interesting pattern that’s been going on since 1969. Note that each major eight year low was followed by a major peak 11 years later. The only exception
was the 1993 low, but in that case the low was mild within an essentially quiet market (see asterisk).
If this 11 year pattern continues, we could see gold shoot up to the $2000-$3000 level within the next two years. But since today’s economic situation is historically extreme, we could see much higher prices for a longer period of time… well beyond 2012, and more like 2017-2018.
This is precisely what we mean by staying with the major trend. It’s powerful right now and we’ll stay with it for as long as it lasts.
By Mary Anne & Pamela Aden
Mary Anne & Pamela Aden are well known analysts and editors of The Aden Forecast, a market newsletter providing specific forecasts and recommendations on gold, stocks, interest rates and the other major markets. For more information, go to www.adenforecast.com
Aden_Forecast Archive |
© 2005-2022 http://www.MarketOracle.co.uk - The Market Oracle is a FREE Daily Financial Markets Analysis & Forecasting online publication.


