


Gold New High Was Not Decisive
Commodities / Gold and Silver 2010 Jun 13, 2010 - 08:29 AM GMTBy: Merv_Burak

 The week started out well but didn’t finish as such. Although gold made new highs it was not decisive. Should gold drop below the $1216 mark we might be in for more downside but if it closes above the $1250 level then the bull is expected to continue.
GOLD : LONG TERM
On the bar or candlestick charts we had made a new high in gold during the week, however, on the long term P&F chart, where we deal in “unit prices” and cut out the noise of unimportant action, we had not yet made a new high. We did reach the previous high but all that does is tell us we may have a double top pattern. Time will tell. The latest P&F action has now given us a higher level for a bear market signal should the price decide to drop. A move back to the $1155 level would now do it. However, a move to $1260 would give us the next projection to watch, at the $1320 level, along its way to still higher prices.
As for my normal indicators we are still in a very well defined long term bull market in gold with the price above its positive sloping moving average line. The momentum indicator is showing long term weakness in the price move to new highs. The indicator remains below its previous May high and below its earlier Dec high. This negative divergence in the momentum indicator may take a little time to come to a conclusion but needs to be watched as a reversal of trend, if it is going to happen, could come anytime. For now the indicator itself is still in its positive zone and just a hair above its still slightly negative trigger line. The volume indicator has also failed to make a new high with gold but ended just below its previous level. It remains, however, above its positive trigger line. All in all, the long term rating remains BULLISH.
INTERMEDIATE TERM
On the intermediate term we have a similar situation in the indicators as in the long term. Gold remains comfortably above its positive moving average line. The momentum indicator is giving us a negative divergence similar to the long term. It is, however, still in its positive zone but very slightly below its positive sloping trigger line. The volume indicator seems to be more inclined towards the lateral direction but remains above its positive trigger line. On the intermediate term the rating remains BULLISH.
SHORT TERM
The past few weeks of gold action has established a short term up trending channel. A close at or below the $1216 mark would break that channel on the down side and suggest more downside following. The move to new highs by gold on Tuesday was not confirmed by the short term momentum indicator. The momentum (or strength) of the move was at a lower level than the earlier move. The more aggressive Stochastic Oscillator is even more emphatic that the move was suspect. It made a lower high even against its move of a week earlier. Now the SO is below its low of the previous week and suggesting that the immediate trend is towards lower prices. Although gold seems to be moving based upon world events one needs to be careful in getting too bullish on the immediate direction for gold. Who knows what will happen on the world front over the next days.
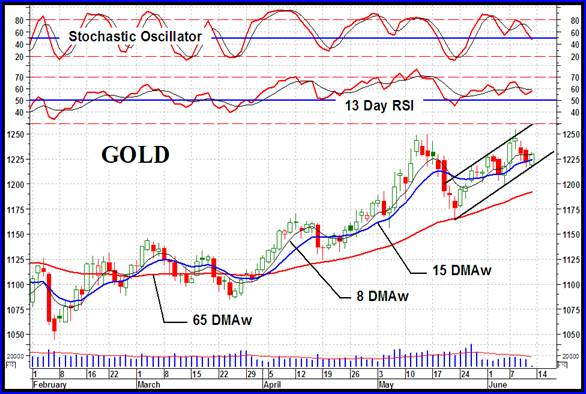
Going to our normal indicators, gold is toying with its short term moving average line but finished the week just above the line, which itself is sloping upwards. The momentum indicator seems to be in a lateral trend although it remains in its positive zone. It closed the week just below its trigger line with the trigger in the process of turning upward. The daily volume activity is very low and below its average value from the past 15 days of trading. For now the indicators sum up to a BULLISH short term rating but that could change quickly.
As for the immediate direction of least resistance, with what I see on the chart I’m inclined to go for the down side but as we know, things could change quickly on the world front and affect the direction of gold.
SILVER
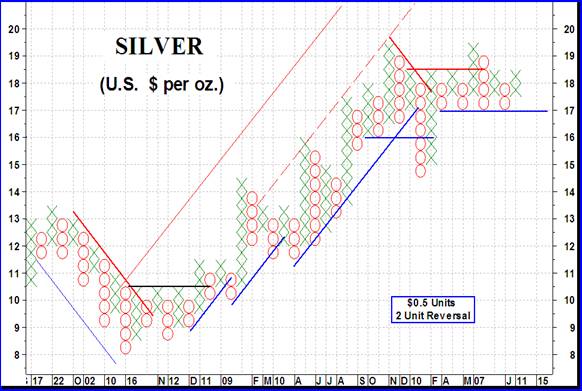
Silver has been hanging back and has not moved into new highs as gold has done. As mentioned in previous commentaries silver is going through what looks like a head and shoulder pattern. That pattern would be confirmed once silver drops to the $17.00 level. That would break below its neckline and the P&F support. Should that occur the H&S projection would then be to about the $15 level, about where it stopped in Feb.
The latest action in silver has the price and its short and intermediate term moving averages all bunched up together and intertwined. Still, the Friday closing price ended barely a hair above both moving average lines and both lines were sloping oh so gently higher. The momentum indicators have been moving sideways at the neutral line level. At the Friday close the intermediate term momentum was just a shade above the line while the short term momentum was just below it. Although looking at the chart one would call the present ratings as neutral but from the indicators the intermediate term comes out BULLISH while the short term gets downgraded just a notch to the + NEUTRAL level.
PRECIOUS METAL STOCKS
Well, in answer to many comments to show some individual stock analysis and more technical “education”, this week I present a “penny” stock, one of the component stocks in my Merv’s Penny Arcade Index. Except for the commentary posted on the preciousmetalscentral web site at http://preciousmetalscentral.com I have left out the name of the stock as some sites that post these commentaries had asked not to mention specific stocks in the commentary. If you should be interested in the stock you can go to the web site and access the free weekly commentary to find out the name. Of course, only subscribers get continuing technical information and ratings for the stock as time goes by.
As “education” I follow a very simple technique for tracking stocks using my version of the P&F method. Basically for a stock to turn bullish I need it to move above two previous Xs and above the primary down trend line. Occasionally, when the primary down trend line is still far above the action and the chart has already shown a break above two previous Xs, I try to assess a secondary down trend line and go with that. Finally, a stock may go bullish BUT is it a good speculative or gambling buy? That requires an estimate of its potential price projection for the move. Using simple P&F count projection methods such projection is calculated. I need at least an initial projection for a 100% move before a bull break is a good speculative or gambling buy. I have found these initial projections to be at least 80% accurate, which still leaves 20% for inaccuracies.
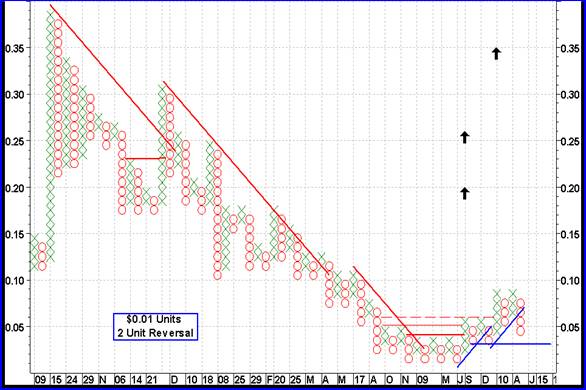
Let’s take a look at the stock. The first upside break came at the $0.26 level. The projection at that point was to the $0.30 level (which it made) but that was not a 100% move so no action was taken. The next time my dual criteria was met for a bull break was at the $0.05 level. That break-out had an initial P&F projection to the $0.20 level for a potential 300% move and a gambler’s buy. The subsequent early move gave two additional projections, to $0.26 and to $0.35. At Friday’s price we still have a potential 6 to 7 bagger move ahead. Now, when you are dealing with these penny stocks, or any stocks, do not expect to be right all the time. ALWAYS expect surprises, and not of the good kind. With this stock a move back to the $0.03 level would tell you that the move was pre-mature or not realistic. Looking at the Merv’s Penny Arcade Index the penny stocks in general seem to be heading for troubled waters so extreme caution is advised if dealing in these pennies.
Another caution while using the P&F technique. There are many books on different P&F techniques. I have reviewed most of them and found them all wanting from the standpoint of tracking the penny stocks, or the stocks under about $3.00. If you are using the P&F technique to track and trade penny stocks my recommendation is for you to experiment and find the technique that provides you with good results, or at least results you are comfortable with. No technique will be perfect so a most important point should be that it gives you the “get out” warning before you lose too much capital.
Next week I’ll be back to reviewing the stocks and Indices in general.
Merv’s Precious Metals Indices Table
Well, that’s it for another week.
By Merv Burak, CMT
Hudson Aero/Systems Inc.
Technical Information Group
for Merv's Precious Metals Central
For DAILY Uranium stock commentary and WEEKLY Uranium market update check out my new Technically Uranium with Merv blog at http://techuranium.blogspot.com .
During the day Merv practices his engineering profession as a Consulting Aerospace Engineer. Once the sun goes down and night descends upon the earth Merv dons his other hat as a Chartered Market Technician ( CMT ) and tries to decipher what's going on in the securities markets. As an underground surveyor in the gold mines of Canada 's Northwest Territories in his youth, Merv has a soft spot for the gold industry and has developed several Gold Indices reflecting different aspects of the industry. As a basically lazy individual Merv's driving focus is to KEEP IT SIMPLE .
To find out more about Merv's various Gold Indices and component stocks, please visit http://preciousmetalscentral.com . There you will find samples of the Indices and their component stocks plus other publications of interest to gold investors.
Before you invest, Always check your market timing with a Qualified Professional Market Technician
Merv Burak Archive |
© 2005-2022 http://www.MarketOracle.co.uk - The Market Oracle is a FREE Daily Financial Markets Analysis & Forecasting online publication.