


The Fed Flashes the Nuclear Quantitative Easing Trump Card
Interest-Rates / Quantitative Easing Jul 29, 2010 - 02:04 PM GMTBy: Gary_Dorsch

 Of ten people who hear the same story or speech, each one might understand it differently. Perhaps, only one of them will understand it correctly. On July 21st, Federal Reserve chief Ben Bernanke was speaking in riddles, as central bankers are apt to do, while delivering his testimony before Congress. Each word that’s uttered by the Fed chief is scrutinized by anxious speculators, who try to interpret the message correctly, before quickly placing bets in the marketplace.
Bernanke is the captain of a ship that is sailing through some very stormy seas, and is desperately trying to steer the economy away from its worst downturn since the Great Depression. The US-housing market is under-water, and putting enormous financial stress on vast numbers of Americans. A record 270,000 US-homes were seized from delinquent owners in the second quarter, and bankers are on pace to claim more than 1-million properties by the end of 2010. Small businesses, the engine of job creation, - are largely cut-off from credit, and are sputtering.
Bernanke acknowledged that the US-economy faces an “unusually uncertain time,” but if necessary, he hinted the central bank would resort to “Quantitative Easing,” (QE), or printing vast quantities of US-dollars, in order to prevent a deflationary spiral. With the US federal funds rate pegged near zero-percent, Bernanke was asked by Senator Jim Bunning if the Fed is “out of bullets,” Bernanke responded, “I don’t think so. We are prepared to take further policy actions as needed to foster a return to full utilization of our nation’s productive potential and price stability.”
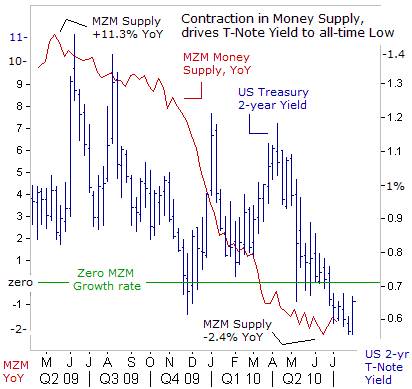
Initially, Bernanke’s doublespeak was interpreted to mean that the Fed chief is worried the possibility of a “double-dip” recession. Within minutes, there was a knee-jerk panic sell-off, that knocked the Dow Jones Industrials about 160-points lower, to as low as the 10,065-level. Yields on the US Treasury’s two-year note fell to a new historic low of 56-basis points, in a flight for safety. Such ultra-low yields have until now, been the exclusive trademark of the Japanese bond market.
But soon after the gist of Bernanke’s comments were fully digested and analyzed, - the US-stock market indexes began to rebound strongly. Industrial commodities, such as crude oil, copper, aluminum, nickel, and iron-ore were also bid higher. The main message behind Bernanke’s riddle was becoming clearer. The Fed is putting a psychological safety net under the stock market, and if necessary, would print vast quantities of US-dollars, in order to inflate asset markets.
Right now, the Fed appears to have enough wiggle room to print vast sums of dollars, under the QE-scheme without running the risk of an outbreak of higher consumer prices. The growth rate of the MZM money supply, a gauge of money readily available for spending is shrinking, and is -1.8% lower from a year ago. The broader M2 aggregate is only +1.9% higher, indicating that banks are still very tight fisted with their depositors’ money, and the excess cash supplied by the Fed, and not yet lending to private businesses or households in a meaningful way.
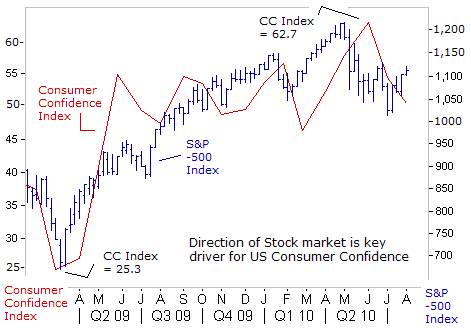
In order to boost the general level of confidence among US-consumers, the “Plunge Protection Team” (PPT) is determined to prevent a slide in the stock market, - the most visible barometer of the financial health and profitability of America’s largest companies. However, the Conference Board’s Consumer Confidence Index slipped to 50.4 in July, from a high of 62.7 in May, rattled by the downturn in the S&P-500 index in the second quarter. Home prices and the value of investment portfolios are vital to confidence, since consumers tend to spend according to how wealthy they feel. And their spending accounts for about 70% of US-economic activity.
In the depths of the “Great Recession,” household net worth sank to as low as $48-trillion. It’s since rebounded 13-percent. Yet even counting the latest stock market recovery, US-net worth would have to rise a further 21% to regain its pre-recession peak of $66-trillion. The result has been shrunken retirement savings accounts and anxiety about spending. The Fed is therefore prepared to unleash all of its weapons, including the nuclear option – QE, in order to prevent the onset of another bearish trend in the stock market.
US-consumers are most downbeat about the lack of job prospects. On the flip side, S&P-500 multi-nationals are posting stellar profits, from stronger sales to faster growing economies in China, Brazil, India, and elsewhere. But S&P-500 companies are hoarding their cash surpluses, and their profits are not trickling down to the unemployed US-job seeker or showing-up in better wages. Thus, there’s a clear dichotomy between signs of a stagnant US-economy, which the traders in the Treasury bond market focus upon, and a buoyant US-stock market, where increasing profits are largely generated in foreign markets.
With the Fed chief vowing to keep the overnight loan rate locked near zero percent for an extended period of time, the federal funds futures market is now forecasting no change in Fed policy until the first quarter of 2011. Fixed income investors are moving out further along the yield curve, in order to find better than razor thin rates of return on their savings. The US Treasury 10-year yield briefly fell to a 15-month low of 2.85% last week, on speculation the Fed would use monetary tools, such as purchases of Treasuries and mortgage securities.
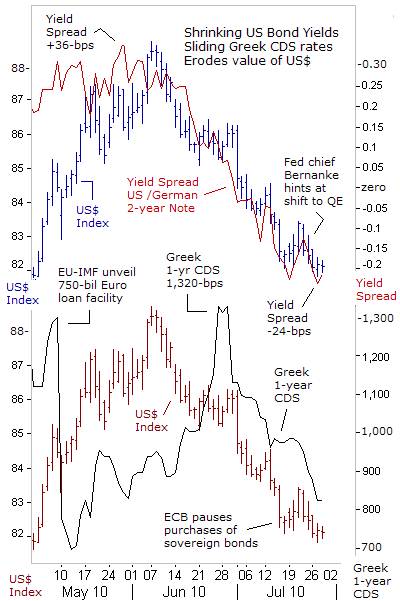
The yield spread between the US Treasury’s 10-year note, and the German Bund, tumbled by 60-basis points (bps) over the past seven weeks, eroding the value of the US-dollar index by eight-percent. German bund yields bounced slightly above their record lows of 2.50%, after it became increasingly apparent that the ECB is not inclined to cut its 1% repo rate anytime soon. The ECB engineered a recovery of the Euro, from a four-year low of $1.1850, to as high as $1.3045, while traders detected the central bank was phasing out its purchases of Greek and other sovereign debt, at a much earlier than expected date.
A so-called stress test, measuring the ability of 91 Euro zone banks to withstand a severe 35% downturn in the stock markets, and a “double-dip” recession, gave 84 of the banks a clean bill of health. The results showed the seven that failed need to raise 27-billion Euros ($35-billion), to meet a Tier 1 capital ratio of 8-percent. This propaganda tool helped to trigger a 100-bps slide in credit default swaps on Greek bonds, to 825-bps this week, and down sharply from a record 1,320-bps.
The US-dollar was being utilized by currency traders as a temporary “safe-haven” from a collapsing Euro, amid fears of a Greek default on its 300-billion Euros of debt. But with CDS rates on Greece’s debt receding, the demand for the deficit ridden US-dollar has also waned. In addition to the Euro, the biggest winners in the anti US-dollar sweepstakes were the Australian dollar, Swiss franc, and the British pound. China took advantage of the US-dollar’s rally in May, by dumping $32.5-billion of its holdings of US Treasury notes to US$867.7-billion.
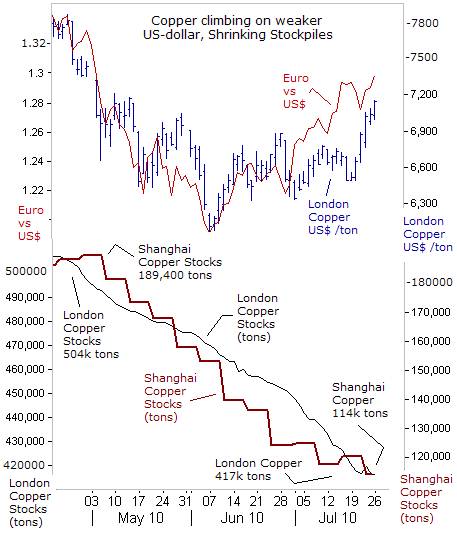
Another beneficiary of the Euro’s recovery to as high as $1.300 was the copper market, which has rebounded by 12% so far in the month of July, towards $7,200 /ton in London. Freeport-McMoRan Copper & Gold (FCX.N) chief Richard Adkerson said copper markets were healthy enough for the world’s second largest copper miner, to bring back production at mines it had idled during the recession.
“There’s still a lot of weakness in the US-economy, but overall the copper markets in the US, northern Europe, to some extent in Korea and Japan, are stronger than we’ve seen them in some time. And China continues to be strong, despite steps they’ve taken to control the growth in their economy and to try to deal with inflation. The physical markets really are stronger than economic indicators in the US. We see our order books filling more strongly than we have in some time,” he said.
Copper recovery coincided with an 11% rally for the Shanghai red-chip index in July to the 2635-level. Copper stockpiles at the London Metal Exchange have also dropped 18% this year to 411,425-tons, signaling global demand is exceeding supply. In Shanghai, copper inventories have also been whittled down by nearly 40% over the past two months, to as little as 114,000-tons. In 2009, China bought about 35% of the global copper supply.
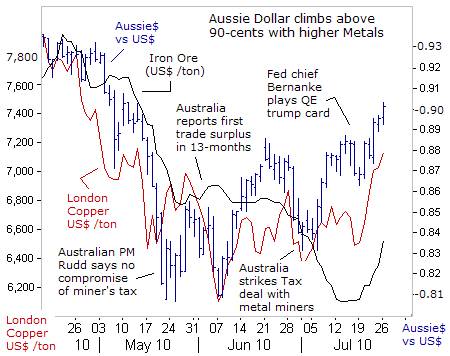
The Australian Dollar has become a barometer of global risk appetite. The Aussie dollar risk penetrated the psychological 90-US-cents barrier this week, as a combination of several events swung in its favor. Risk aversion began to ebb in the Greek CDS market, and Bernanke’s implied threat to play the QE trump card gave the Aussie a big boost. With ultra-low interest rates in the Japanese the US Treasury markets, the Aussie dollar is attracting foreign capital to its higher interest rates, compared to the rest of the industrialized world.
It’s also been fueled upward by growing trade surpluses earned from sales of coking coal, and iron-ore, Australia’s top two exports, which earn a quarter of last year’s A$250-billion export revenue. A brisk rally in base metals, such as copper, aluminum, nickel, and iron-ore, combined with a rebound in Shanghai red-chips, helped to create the perfect storm for the Aussie dollar.
The Aussie dollar’s rebound began shortly after July 2nd, at around 84-US-cents, when Canberra finally ended a damaging dispute with global miners BHP Billiton, Rio Tinto and Xstrata, by dumping its 40% super profits tax for a lower resources rent tax backed by key global miners. The new resources rent tax won’t apply until July 1, 2012, and will be at a lower rate of 30 percent. The government’s compromise means it will receive A$1.5 billion less revenue than under its planned “super profits” tax, which was suppose to raise around A$12 billion.
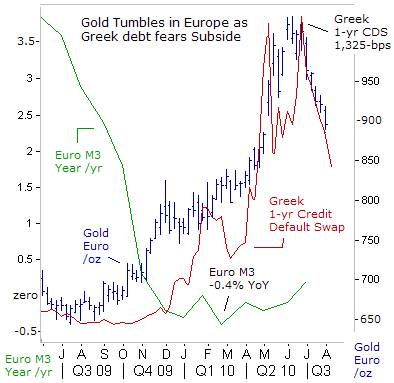
Despite Mr Bernanke’s threat to brandish the nuclear QE-weapon, implying massive new waves of money printing, the price of gold has tumbled 15% since hitting its all-time high in Europe on June 7th, to around 890-euros /oz today. Instead, subsiding fears about a Greek debt default, as measured by a sharp slide in Greek CDS rates, and a narrowing of Greek, Portuguese, and Spanish bond yield spreads with German bunds, have conspired to weaken the gold market.
With the gold market’s preoccupation with the Euro-zone debt crisis fading slowly into the background, the focus could suddenly switch to the anemic growth of the Euro M3 money supply, which was barely growing at an annualized +0.2% rate in June. The growth rate of Euro M3 has been essentially flat for the past six-months, despite ultra-low borrowing rates, with bank lending at a virtual standstill.
Long periods of anemic money supply growth, could lead a Japanese style pattern of price deflation that could plague the Euro-zone and the US-economies, and is adding to selling pressure on precious metals, such as gold and silver. Mr Bernanke is praying that he won’t need to play the nuclear QE-trump card again, so the Fed can keep its gunpowder dry for another day. Gold and silver are famous for wicked corrections, within the context of longer-term bull markets. Selling pressure might continue until the Fed pulls the trigger, and unleashes a new round of QE.
This article is just the Tip of the Iceberg of what’s available in the Global Money Trends newsletter. Subscribe to the Global Money Trends newsletter, for insightful analysis and predictions of (1) top stock markets around the world, (2) Commodities such as crude oil, copper, gold, silver, and grains, (3) Foreign currencies (4) Libor interest rates and global bond markets (5) Central banker "Jawboning" and Intervention techniques that move markets.
By Gary Dorsch,
Editor, Global Money Trends newsletter
http://www.sirchartsalot.com
GMT filters important news and information into (1) bullet-point, easy to understand analysis, (2) featuring "Inter-Market Technical Analysis" that visually displays the dynamic inter-relationships between foreign currencies, commodities, interest rates and the stock markets from a dozen key countries around the world. Also included are (3) charts of key economic statistics of foreign countries that move markets.
Subscribers can also listen to bi-weekly Audio Broadcasts, with the latest news on global markets, and view our updated model portfolio 2008. To order a subscription to Global Money Trends, click on the hyperlink below, http://www.sirchartsalot.com/newsletters.php or call toll free to order, Sunday thru Thursday, 8 am to 9 pm EST, and on Friday 8 am to 5 pm, at 866-553-1007. Outside the call 561-367-1007.
Mr Dorsch worked on the trading floor of the Chicago Mercantile Exchange for nine years as the chief Financial Futures Analyst for three clearing firms, Oppenheimer Rouse Futures Inc, GH Miller and Company, and a commodity fund at the LNS Financial Group.
As a transactional broker for Charles Schwab's Global Investment Services department, Mr Dorsch handled thousands of customer trades in 45 stock exchanges around the world, including Australia, Canada, Japan, Hong Kong, the Euro zone, London, Toronto, South Africa, Mexico, and New Zealand, and Canadian oil trusts, ADR's and Exchange Traded Funds.
He wrote a weekly newsletter from 2000 thru September 2005 called, "Foreign Currency Trends" for Charles Schwab's Global Investment department, featuring inter-market technical analysis, to understand the dynamic inter-relationships between the foreign exchange, global bond and stock markets, and key industrial commodities.
Copyright © 2005-2010 SirChartsAlot, Inc. All rights reserved.
Disclaimer: SirChartsAlot.com's analysis and insights are based upon data gathered by it from various sources believed to be reliable, complete and accurate. However, no guarantee is made by SirChartsAlot.com as to the reliability, completeness and accuracy of the data so analyzed. SirChartsAlot.com is in the business of gathering information, analyzing it and disseminating the analysis for informational and educational purposes only. SirChartsAlot.com attempts to analyze trends, not make recommendations. All statements and expressions are the opinion of SirChartsAlot.com and are not meant to be investment advice or solicitation or recommendation to establish market positions. Our opinions are subject to change without notice. SirChartsAlot.com strongly advises readers to conduct thorough research relevant to decisions and verify facts from various independent sources.
Gary Dorsch Archive |
© 2005-2022 http://www.MarketOracle.co.uk - The Market Oracle is a FREE Daily Financial Markets Analysis & Forecasting online publication.